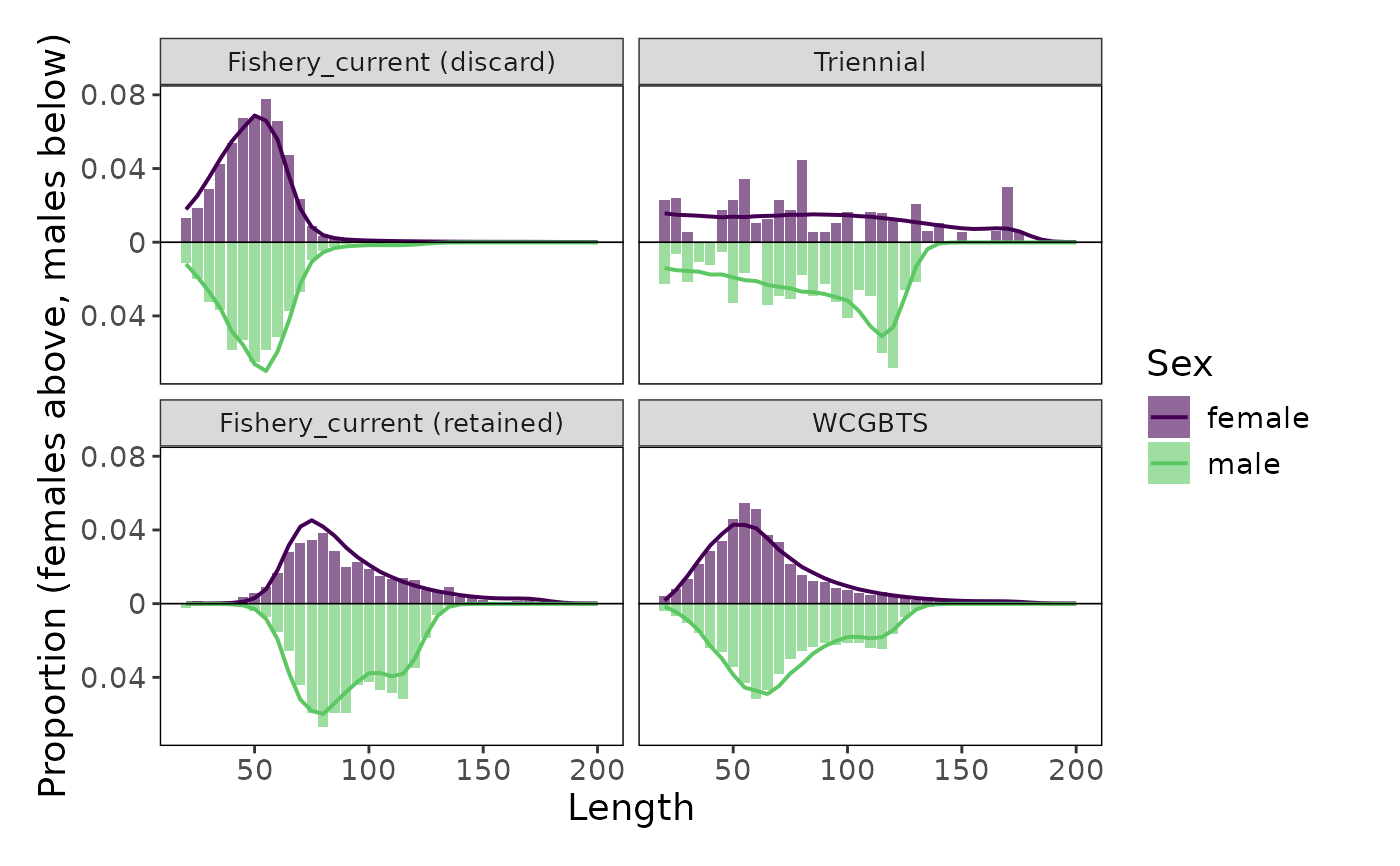
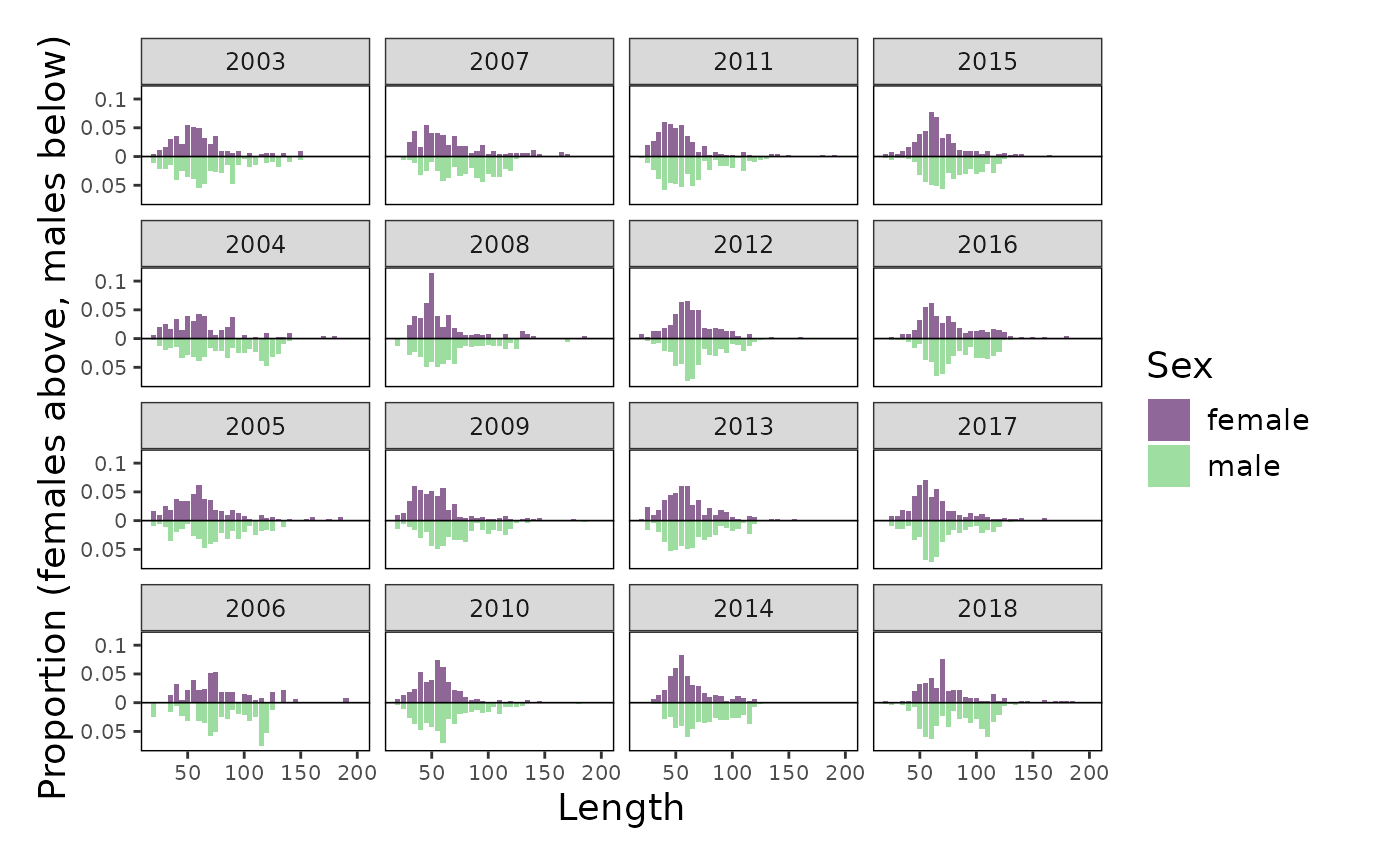
Plot age or length compositions as distributions (proportion by bin), one
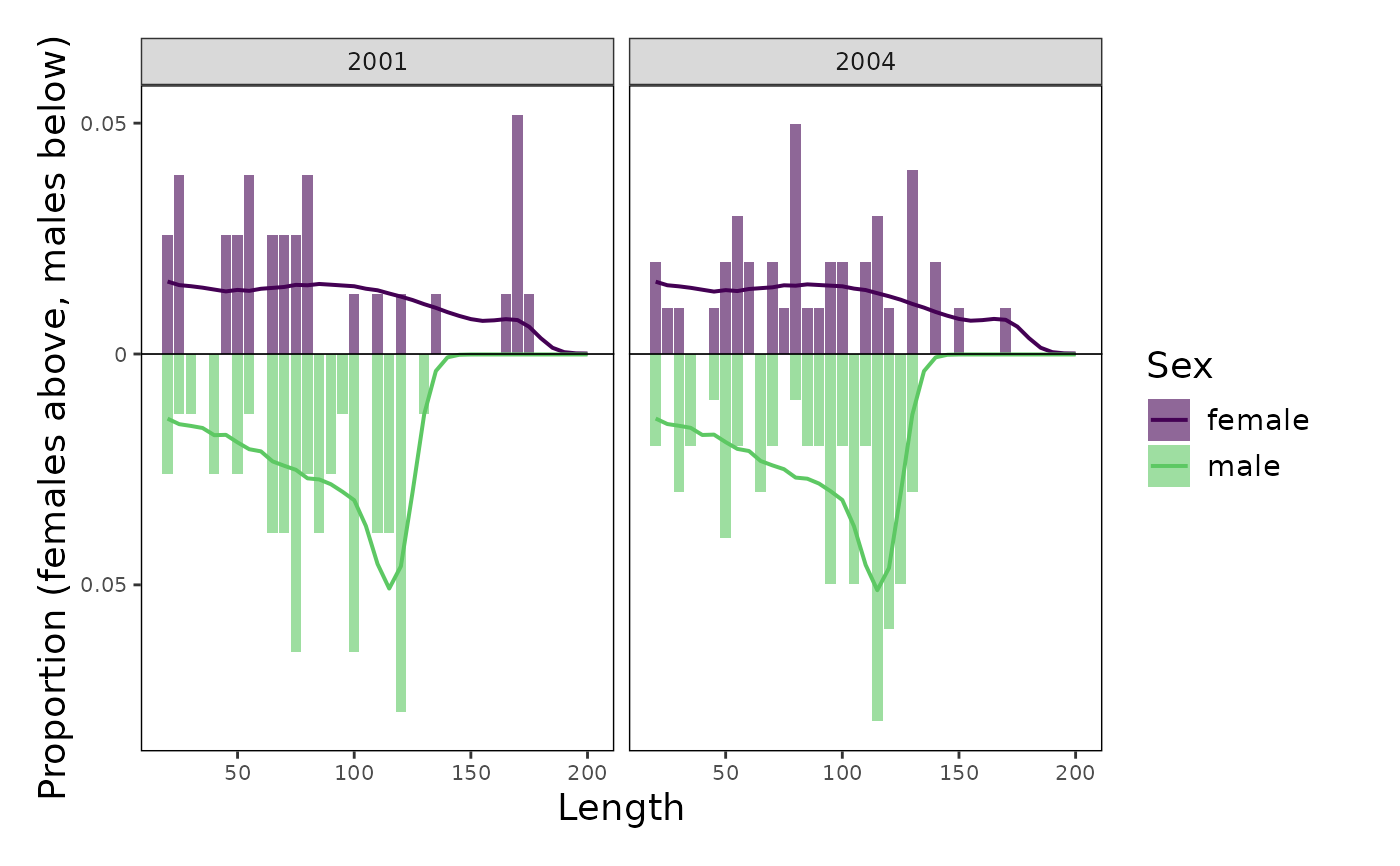
panel per year, optionally overlaying the model-expected values. Setting
aggregate = TRUE instead sums the compositions across years so that each
fleet is summarized in a single panel.
plot_composition_distribution(
  dat,
  show_expected = TRUE,
  aggregate = FALSE,
  comp_type = NULL,
  fleet = NULL,
  ncol = NULL,
  direction = "v"
)
Arguments
- dat
A tibble returned from
convert_output()that contains composition data (see bigskate_lencomp), or composition data in any other format accepted byprepare_composition_data().- show_expected
Logical. TRUE/FALSE; overlay the expected values as lines. Ignored if
datcontains no expected values. Default: TRUE- aggregate
Logical. TRUE/FALSE; aggregate compositions across years within each fleet. Years are weighted by their sample size when sample sizes are available. Default: FALSE
- comp_type
String. Type of composition to keep when
datcontains more than one. Options: "age", "length", or NULL (keep all). Default: NULL- fleet
Character or numeric vector. Fleet(s) to keep, matching either the fleet name (e.g., "Fishery_current") or the fleet name with its partition (e.g., "Fishery_current (retained)"). NULL keeps all fleets. Default: NULL
- ncol
Number. Number of facet columns. NULL lets
ggplot2choose. Default: NULL- direction
String. Order of the panels: "v" fills panels down each column and then across, so consecutive years are stacked vertically and cohorts are easier to follow from panel to panel; "h" fills panels across each row.
Default: "v"
Value
A ggplot2 object.
Details
When compositions are sex-specific (both "female" and "male"
values in the sex column), females are plotted above zero and males
below zero. Bars show observed proportions and lines show expected
proportions. Females and males are colored with the two ends of
viridis::viridis(2, option = "viridis", end = 0.75) ("#440154" and
"#5DC863"); add ggplot2::scale_fill_manual() and
ggplot2::scale_color_manual() to the returned plot to use other colors.
If more than one fleet is plotted without aggregating, panels are
created for every fleet and year combination; use fleet to focus on one
fleet at a time.
Equivalent plots in other packages
r4ss: r4ss::SSplotComps() subplot 1 (by year) and
subplot 21 (aggregated across years).
See also
Examples
# Observations only
plot_composition_distribution(bigskate_lencomp, fleet = "WCGBTS", show_expected = FALSE)
 # Observed and expected
plot_composition_distribution(bigskate_lencomp, fleet = "Triennial")
 # All fleets aggregated across years
plot_composition_distribution(bigskate_lencomp, aggregate = TRUE)