Plot sex ratios implied by composition data
Source:R/plot_composition.R
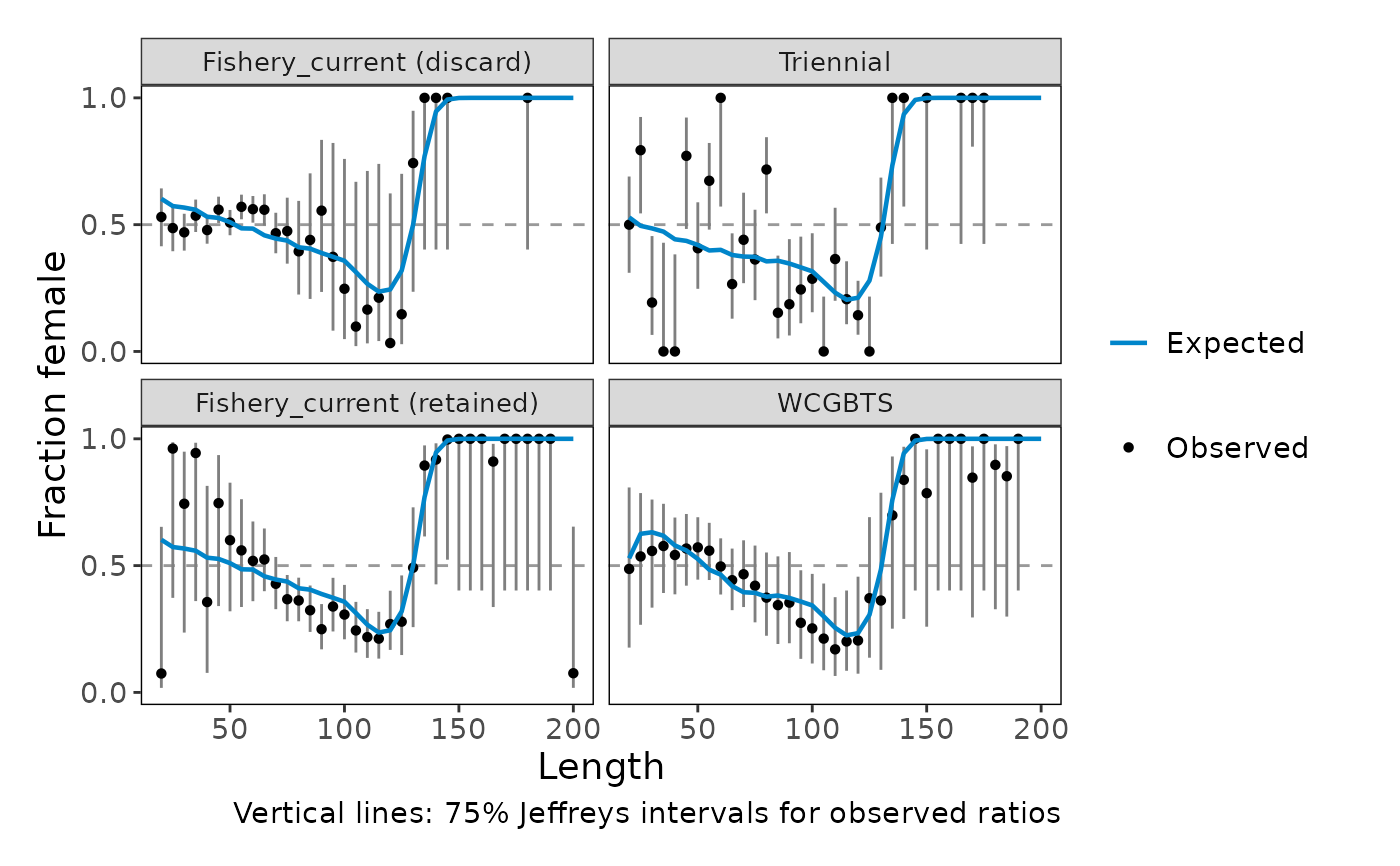
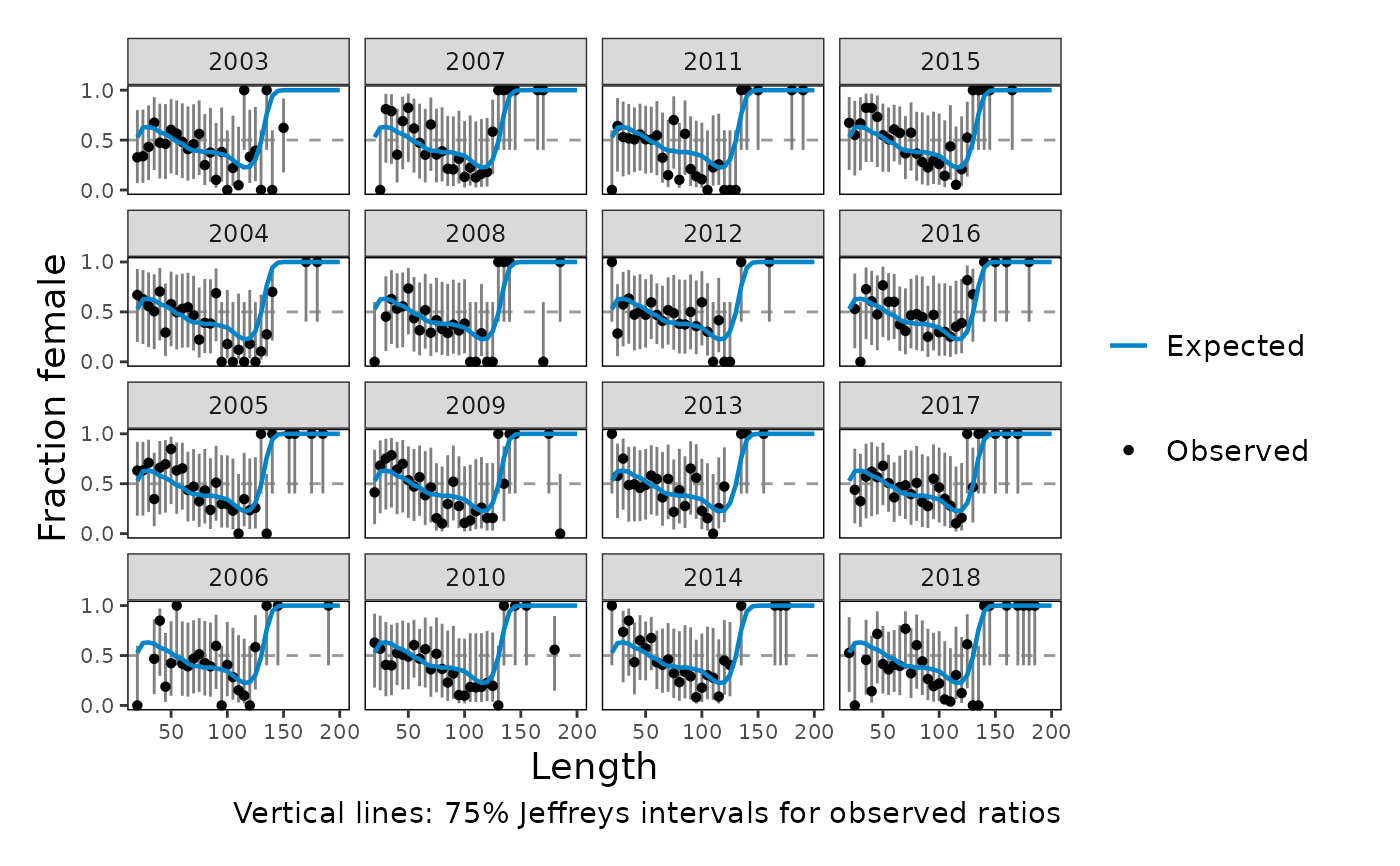
plot_composition_sexratio.RdPlot the proportion female, female / (female + male), by bin for the observed and expected compositions. Trends in the lack of fit to sex ratios can be easier to see here than in residuals, especially for bins with small proportions.
plot_composition_sexratio(
  dat,
  aggregate = FALSE,
  interval = 0.75,
  comp_type = NULL,
  fleet = NULL,
  ncol = NULL,
  direction = "v"
)
Arguments
- dat
A tibble returned from
convert_output()that contains composition data (see bigskate_lencomp), or composition data in any other format accepted byprepare_composition_data().- aggregate
Logical. TRUE/FALSE; aggregate compositions across years within each fleet. Years are weighted by their sample size when sample sizes are available. Default: FALSE
- interval
Number. Coverage of the interval around the observed sex ratio, calculated as a Jeffreys interval using the sample size in each bin (the sample size multiplied by the proportion of the composition in the bin). Set to NULL to omit intervals. Intervals are only shown when sample sizes are available. Default: 0.75
- comp_type
String. Type of composition to keep when
datcontains more than one. Options: "age", "length", or NULL (keep all). Default: NULL- fleet
Character or numeric vector. Fleet(s) to keep, matching either the fleet name (e.g., "Fishery_current") or the fleet name with its partition (e.g., "Fishery_current (retained)"). NULL keeps all fleets. Default: NULL
- ncol
Number. Number of facet columns. NULL lets
ggplot2choose. Default: NULL- direction
String. Order of the panels: "v" fills panels down each column and then across, so consecutive years are stacked vertically and cohorts are easier to follow from panel to panel; "h" fills panels across each row.
Default: "v"
Value
A ggplot2 object.
Details
Requires sex-specific compositions with both "female" and
"male" values in the sex column of dat. Points show observed ratios
and lines show expected ratios. As in r4ss, the smallest observed
proportion in each composition (such as the small constant Stock Synthesis
adds to every bin) is subtracted from the observed and expected values
first, so bins with no fish observed are omitted. When aggregate = TRUE, female and male
compositions are summed across years (weighted by sample size when
available) before calculating ratios.
Equivalent plots in other packages
r4ss: r4ss::SSplotSexRatio() with
sexratio.option = 2 (female:total).
Examples
plot_composition_sexratio(bigskate_lencomp, fleet = "WCGBTS")
 plot_composition_sexratio(bigskate_lencomp, aggregate = TRUE)