# Adjust below example based on audience
library(asar)
create_template(
  format = "pdf", # optional "html"
  type = "sar", # add'l options: "safe", "nemt", "pfmc"
  office = "PIFSC",
  region = "Hawaii",
  species = "Crimson jobfish",
  spp_latin = "Pristipomoides filamentosus",
  authors = c("Samantha Schiano" = "OST", "Jane Doe"="PIFSC"),
  file_dir = getwd() # folder where the "report" folder will be saved
)Day 2
Objectives
- Learn the basics of creating a stock assessment report using {asar}
- Understand the complexities and customization options of the package
- Practice using {asar} and ask questions
Introduction
Icebreaker
Welcome! Please open the Day 2 communal notes doc and participate in the icebreaker exercise.
Code of conduct
Everyone participating in this workshop is required to abide by the terms of our Code of Conduct. We encourage you to contribute to a positive environment for our community by:
- Demonstrating empathy and kindness toward other people
- Being respectful of differing opinions, viewpoints, and experiences
- Giving and gracefully accepting constructive feedback
- Accepting responsibility and apologizing to those affected by our mistakes, and learning from the experience
- Focusing on what is best not just for us as individuals, but for the overall community
If you believe that someone is in violation of the Code of Conduct, please report the incident to the workshop instructors and/or the community leaders responsible for enforcement using this form.
Materials for today’s lesson
- Day 2 communal notes doc
- Contains resources (from us and you!) and areas for note-taking
- Sample data
- Sample model output data for coding demonstrations
How to engage with us
Questions: Please raise your hand, or write your question in the chat, at any time. Depending on our schedule, we may ask that you save larger questions for breaks.
{asar}: Automated Stock Assessment Reporting
In this section we will cover the basics of {asar} by generating a stock assessment report and going through basic navigation of the template.
Installation
{asar} should already be installed if you attended Day 1. If not, please install this package by following the instructions in the pre-workshop checklist.
Note
If you receive an error message when attempting the download the package, please ask the instructor for alternative directions or see the README on the {asar} repository.
Overview of {asar}-based reporting workflow
Main steps for creating a stock assessment report with {asar}:
- Install packages
- Convert model output into format usable by {asar}
- Create the report skeleton
- Make child docs containing figures and tables (made with {stockplotr} or by other means)
- Fill in child docs with text
- Render report
- Add accessibility features (PDF tags and alternative text for figures)
Tip
Open the {asar} cheatsheet for a visual overview of the main workflow!
Recommended workflow
We highly recommend using a project-based workflow. This involves creating an R project for each report, which facilitates returning to your session and maintaining files. Using either a project or GitHub repository will help you in the long run.
To create a new R project in Rstudio:
File > New Project > New or Existing Directory
Important
If you use VSCode or Positron for your IDE, by navigating to a folder on your computer, it will automatically initialize a project-like environment.
The main functions
{asar} revolves around a few primary functions and contains several support functions that help make the template. While most are accessible to the user, they would not perform helpful functions for them. Today, we will focus on the following functions:
asar::create_template()stockplotr::convert_output()(This function is now located within {stockplotr} but is useful for building {asar} reports)
asar::create_template()
What it does:
Generates a set of files that setup a stock assessment report with its supporting files.
Within the created files is the “skeleton file” which drives the render of the entire report. For those familiar with Rmarkdown or Quarto books, this is operating similar to a .yml file. The other Quarto files found in your folder will be what we refer to as “child documents”, or child docs for short. These are the actual files that you will fill in when writing your report. These are the bulk of your content!
Try it out!
create_template() contains A LOT of arguments that allow the user to customize their document how they want. The function contains a set of defaults that would produce a template that could be rendered, but contains no real information relevant to the target stock.
So, let’s do more than just create a blank template! The following arguments are some key parts to fill in for a specific stock assessment report:
| Argument | Options |
|---|---|
| format | pdf, html |
| type | sar, pfmc, safe, nemt |
| office | afsc, pifsc, nefsc, nwfsc sefsc, swfsc |
| region | - |
| species | - |
| spp_latin | - |
| year | - |
| authors | - |
| file_dir | - |
Tip
Notice the authors syntax. It contains a vector with:
- The author’s first and last name
=sign- Initials of the author’s office or region (their affiliation)
- To denote a specific location within a region, add a hyphen followed by the first letter of each word of the location (city, state). Example: “SWFSC-LJCA” stands for “Southwest Fisheries Science Center, La Jolla, California;”AFSC-NOR” stands for “Alaska Fisheries Science Center, Newport, Oregon”.
All affiliation acronyms are in the “affiliations” file.
Run it!
You should see a folder called “report” where you indicated in the argument file_dir. It should have a set up that looks like this:
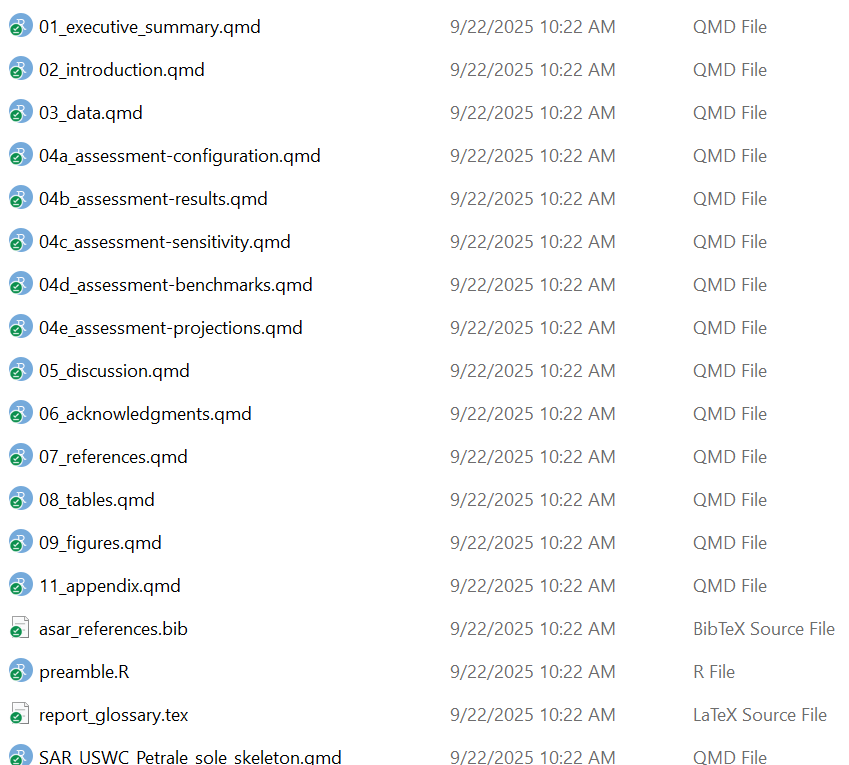
Note
You should see a variety of messages reported in the console to indicate that it worked! For a blank template with no errors, it should look like this:
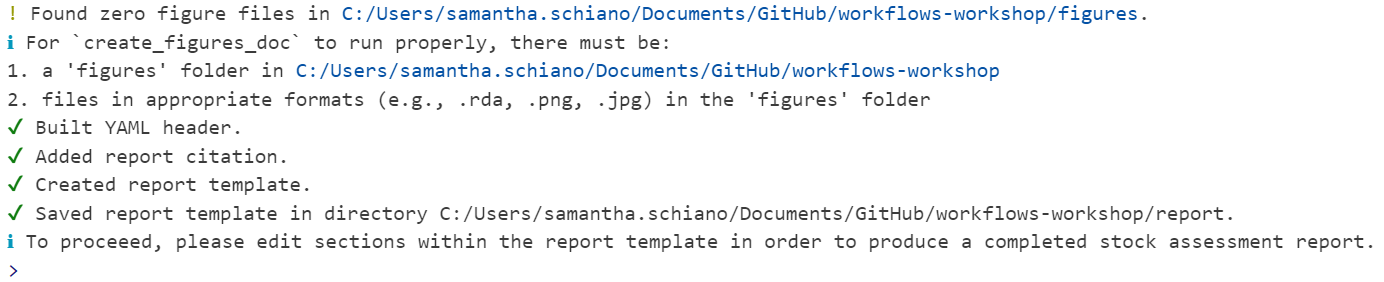
Let’s take a tour of the content we created!
The skeleton
As previously mentioned, the skeleton file controls the rest of the report. This is the file you go to to compile your report, change formatting, or add quantities to reference in your document.
Note
Your skeleton file will not be called “skeleton.qmd”. Its filename will be comprised based on the arguments you added to create_template(), such as the report type, region, and species.
For the example above, it will be called “sar_USWC_Petrale_sole_skeleton.qmd”.
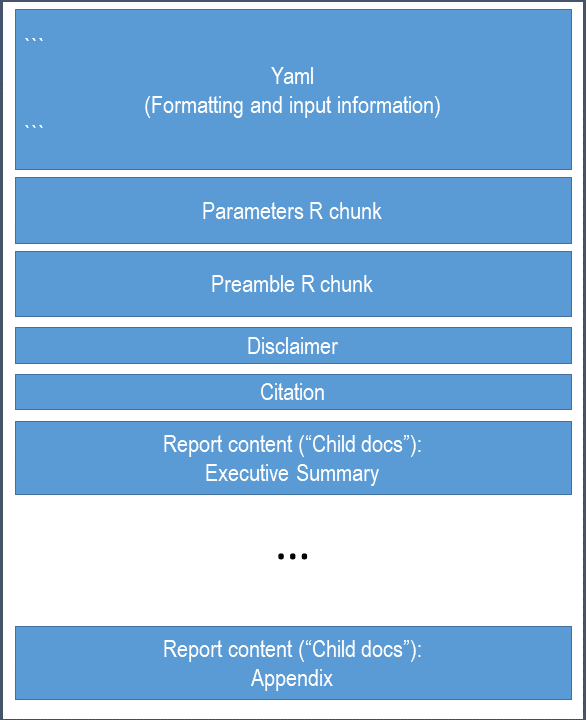
We went over the basics of a Quarto YAML in Day 1, but when using {asar}, you don’t actually have to fill in anything yourself. The beauty of using {asar} is that it removes this task, but filling out information provided in the create_template() arguments and providing the template custom formatting that is part of the package (and the NOAA standard!).
Note
You shouldn’t have to adjust the YAML much, if at all. However, if your species does not match with an image in our database, then you can edit the YAML to add a filepath leading to your own cover image.
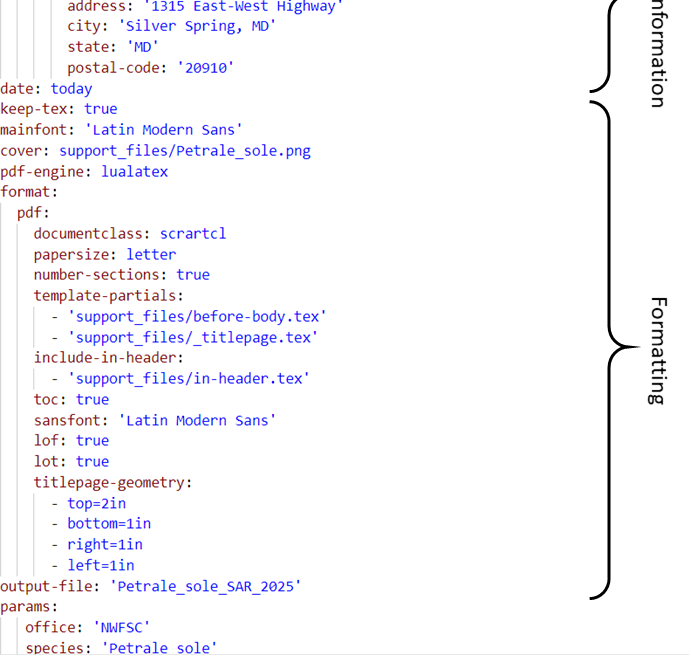
The YAML controls the following:
- title
- authorship
- formatting
- rendered file name
- parameters
- species cover image
- bibliography
- citation style
Parameterization
Quarto has a cool feature that allows users to parameterize their document by utilizing markdown’s ability to render in-line code throughout your writing. In the YAML, there are pre-added parameters of the species, Latin name, region, and office. These are called in through an R chunk after the YAML.
You have two options for calling these parameters in your writing.
- ` r params$species ` (Quarto parameterization)
- ` r species ` ({asar} use of parameterization)
The preamble
The preamble is an R chunk that loads in a script called “preamble.R” which extracts key quantities commonly referenced in stock assessment reports. This will only work with a standard results file converted using asar::convert_output(), which we will get to shortly.
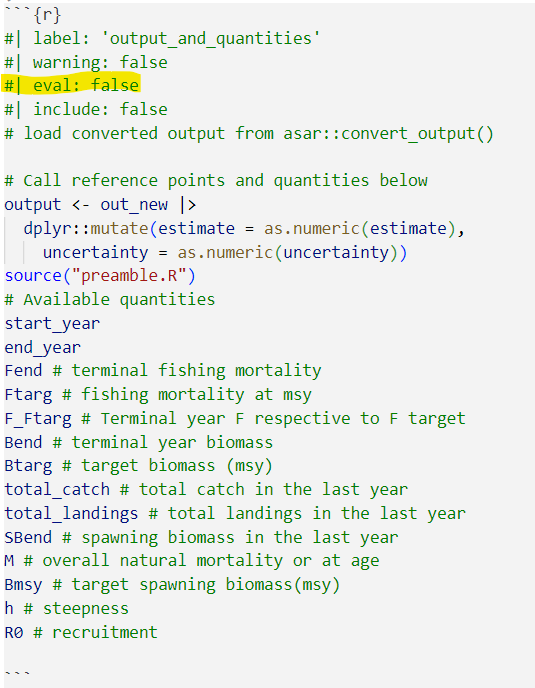
The quantities in found in this chunk can be referenced in-line throughout the document:
` r R0 `
Note
For more information on markdown notation, see Day 1 of this workshop or navigate to our article on the topic!
Let’s find the preamble and see the methods to edit it
The content
The “child docs” are where you as the assessment author or contributor report out the information you need to include. The template is highly modular so there are files for each section of the report and sometimes files for subsections. The default {asar} template creates child docs following the NOAA standard stock assessment report guidelines consisting of the following:
- executive summary
- introduction
- data
- assessment (modelling and results)
- discussion
- acknowledgements
- references
- tables
- figures
- appendix
Each child doc contains pre-determined headers and labels for the author to reference back to throughout the document. There are also descriptions within each section that depict what you should report on throughout the document. You can either keep or remove these notes once the document is finished, either way, they will not be included in your final report.
Child docs are not intended to be rendered on their own, but only from the skeleton as a whole!
Important
We are advising everyone that if any content needed beyond the standard guidelines gets placed in the appendix; however, we encourage everyone to think about the importance of the content in terms of review for management versus CIE or SSC review.
Demo of child docs and adding quantities from the preamble into your document
Please add the following text into your “introduction” section:
The stock assessment for `r params$species` was conducted by the `r params$office` in `r params$region`. The terminal spawning biomass for the current assessment year (`r end_year`) was `r SBend`. You can find more information on the results of this assessment in @sec-assmt-results. The guidelines for this report follow those outlined in @Abrams2014.
CautionPractice exercises: Foundational
create_template() use cases
Run
create_template(). Fill in your own values foroffice,region,species,spp_latin, andyear. Use default values for all remaining arguments.Whoops! You forgot to add the report author’s name and affiliation (yours!). Open the report skeleton and edit the YAML with this information.
You realize that your report will frequently reference another species: Patrickicus starrus. Add a new parameter to the report’s YAML so that you can reference “Patrickicus starrus” with a simple “ps”.
Open up the Executive Summary qmd file and add a sentence that references your new parameter.
CautionAnswers for Practice exercises: Foundational
create_template() use cases
- Run
create_template(). Fill in your own values foroffice,region,species,spp_latin, andyear. Use default values for all remaining arguments.
Answer: Run code similar to the following, adding in your own values for the arguments below.
create_template(
    office = "SEFSC",
    region = "Southeast Coast",
    species = "Atlantic Bigeye Tuna",
    spp_latin = "Thunnus obesus",
    year = 2026
)- Whoops! You forgot to add the report author’s name and affiliation (yours!). Open the report skeleton and edit the YAML with this information.
Answer: Open the .qmd file with “skeleton” in the filename. Edit the YAML’s “author” section to go from something like the first chunk to the second chunk.
# Original YAML snippet (located just beneath the title)
author:
  - name: 'FIRST LAST'
    affiliations:
      - name: 'NOAA Fisheries'
        address: 'ADDRESS'
        city: 'CITY'
        state: 'STATE'
        postal-code: 'POSTAL CODE'
# Updated YAML snippet
author:
- name: 'Patrick Star'
affiliations:
- name: 'NOAA Fisheries Southeast Fisheries Science Center'
address: '75 Virginia Beach Drive'
city: 'Miami, FL'
state: 'FL'
postal-code: '33149'- You realize that your report will frequently reference another species: Patrickicus starrus. Add a new parameter to the report’s YAML so that you can reference “Patrickicus starrus” with a simple “ps”.
Answer: Open the .qmd file with “skeleton” in the filename. Edit the YAML’s “params” section and add the following line:
# Updated YAML snippet
params:
   office: 'SEFSC'
   species: 'Atlantic Bigeye Tuna'
   spp_latin: 'Thunnus obesus'
   region: 'Southeast Coast'
ps: 'Patrickicus starrus' # <-- new line- Open up the Executive Summary qmd file and add a sentence that references your new parameter.
Answer: Open the 01_executive_summary.qmd file and add a line that references the param ‘ps’, like the following:
"The species `r params$ps` was abundant throughout the study area."The sentence will render as such:
“The species Patrickicus starrus was abundant throughout the study area.”
stockplotr::convert_output()
What it does:
This function, which was formerly located within {asar} but has been moved to {stockplotr}, converts an output file from a stock assessment model to a standard format. This file can be used to extract quantities within the preamble and to build figures and tables with {stockplotr} (covered in Day 3).
The convert_output function currently accepts output from Stock Synthesis (Report.sso) version 3.30 and higher, Beaufort Assessment Model (BAM; output.rda), Fisheries Integrated Modelling System (FIMS; R object), or Rceattle (model output object). We are actively working on expanding the convert_output function to be compatible with all major U.S. stock assessment models. This function takes a lot of resources to develop, so any contribution to the package is welcome! If you have a model that is not currently compatible with stockplotr::convert_output(), please navigate to our article describing the function and how to get your output in the same format as those produced from the converter!
Let’s try it out!
We have uploaded an example Report.sso file in the workshop GitHub, but if you have a compatible output file, we encourage you to use your own.
# Identify output file
output_file <- file.path("example_output", "Report.sso")
# convert the output
paka <- stockplotr::convert_output(
  output_file,
  save_dir = file.path(getwd(), "report", "paka_conout.rda")
  )

# copy the converted output to your wd too, for later usage
file.copy(
  from = file.path(getwd(), "report", "paka_conout.rda"),
  to = getwd()
  )
Run it!
paka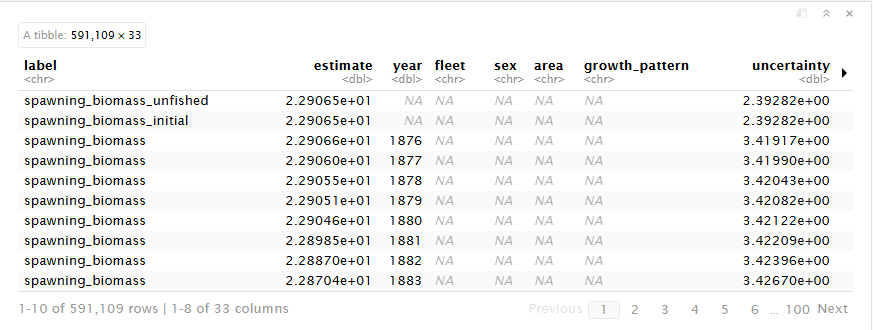
Tip
convert_output() will recognize which model the results file came from as well as fleet names. In the rare case either of these are incorrect, the function contains arguments of model and fleet_names which you as the user can indicate for the function.
If you are explicitly stating fleet names, make sure they are in the order you expect them to be found in the file.
Format of converted output
The converted output is a tibble that reframes and reshapes your data. The tibble contains each output value as a row with its error and any associated indexing values.
Note
Let’s walk through a standard output file in more detail.
CautionPractice exercises: Get familiar with standard output
- Filter the output data for spawning biomass that only includes years 2000 to 2020.
TipHints
Phrases like “spawning biomass” will be spelled out in the ‘label’ column, with words typically separated with an underscore (_).
You can see all values in a dataframe column, sorted alphabetically, with the
unique()andsort()functions.Use the
grepl()function to filter a dataframe column for values that match specific patterns.
- Extract the SBmsy reference point from the output data.
CautionAnswers for Practice exercises: Get familiar with standard output
- Filter the output data for spawning biomass that only includes years 2000 to 2020.
Answer: Use the dplyr filtering functions or other subsetting function to filter the data.
filtered_data <- petrale |>
  dplyr::filter(
    grepl("^spawning_biomass$", label),
    year > 2000,
    year < 2020
  )
Note
Notice that there are multiple time series of spawning biomass. This is because the original model output reports these values in different modules. We maintained the integrity of the original model output by keeping all of these time series. You may want to further filter the data to only include spawning biomass from a specific module.
- Extract the SBmsy reference point from the output data..
Answer: Filter your initial converted data by label name where you can either use “msy” or “spawning_biomass_msy”. All quantities are spelled out except for msy or spr.
SBmsy <- petrale |>
  dplyr::filter(
    grepl("^spawning_biomass_msy$", label)
  ) |>
  dplyr::pull(estimate)
Note
For more information, navigate to this article describing the conversion process and find ways your can convert your model’s data!
Advanced {asar} workflow
Now we are going to walk-through a more complex use of {asar} by
- Updating reports after initial setup
- Adding additional parameters
- Adding model results
- Adding a new author
- Customizing sections
Rerendering report
We understand that it’s easy to forget to enter in all of the information you need for a report on its initial creation! Because of this, we made the argument “rerender_skeleton” that adds on any new information to the skeleton file that you might want such as additional authors, a new species image, parameters, or anything that is open for you to customize in the skeleton file.
You COULD do this manually, but using the function both allows you to create a record of your changes (making it more reproducible) and makes the Quarto YAML less intimidating to new users!
Note
You can run re-render skeleton as often as you want, it will always edit the current skeleton in the folder. Please note: any additional skeleton files will make this process fail. The process will also verify that you want to overwrite the current skeleton and either keep or replace the key quantities file.
Create-your-own
There are three additional template options available to users to use while we work to set standard assessment report guidelines across the country:
- SAFE reports (
create_template(type = 'safe')) - NEFSC management track reports (
create_template(type = 'nemt')) - PFMC guidelines (
create_template(type = 'pfmc'))
You can also:
- add new sections within the current outline
- add new sections in individual sections
- select sections of the standard template to include in your report
Today, we will be going over how to customize your template by selecting a subset of the standard guidelines, then adding in a new section after our introduction.
First, let’s make our template.
We are creating a new report, so please set your working directory to a new folder or rename our previous “main” report folder to “main_report” or something along those lines.
asar::create_template(
  # Previous arguments we used for main report
  type = "sar",
  office = "PIFSC",
  region = "Hawaii",
  species = "Crimson jobfish",
  spp_latin = "Pristipomoides filamentosus",
  authors = c("Samantha Schiano" = "OST"),
  # New arguments
  custom = TRUE, # set this to TRUE when you're choosing a subset of standard sections
  custom_sections = c("executive_summary",
                      "introduction",
                      "data"), # list of sections from SAR to add
  new_section = "Changes to the Model", # new section name
  section_location = "after-introduction" # location of new section
 )
Tip
To identify what sections you can include from the standard guidelines (i.e., options for custom_sections), you can run list.files(system.file("templates", "skeleton", package = "asar")). Note: this only includes sections within a standard template. To see other sections for available templates, replace “skeleton” with your target template acronym.
Don’t worry if you forget! You can find this code in the documentation for the custom_sections argument.
Now, let’s rename our folders: “report” –> “custom_report”, and “main_report” –> “report”. This will allow us to continue working with our original report tomorrow by adding figures and tables.
Tip
Check out the “Frequently Asked Questions (FAQs)” vignette to find how to solve common issues encountered when using {asar}.
CautionPractice exercises: Advanced
create_template() use cases
Create a stock assessment report template tailored for the AFSC (a SAFE report).
Create a stock assessment report template with two main sections: an executive summary and an introduction (the following sections will be added automatically: acknowledgments, references, tables, figures).
Whoops! You forgot to add your species name, and now you don’t have a cover image. Run
create_template()with the argumentrerender_skeleton = TRUE, and add your species name (common and scientific names) as two additional arguments: “Petrale sole” (Eopsetta jordani).
CautionAnswers for Practice exercises: Advanced
create_template() use cases
- Create a stock assessment report template tailored for the AFSC (a SAFE report).
Answer:
asar::create_template(
  type = "safe"
)- Create a stock assessment report template with two main sections: an executive summary and an introduction (the following sections will be added automatically: acknowledgments, references, tables, figures).
Answer:
asar::create_template(
    authors = c("Samantha Schiano" = "OST"),
    custom = TRUE,
    custom_sections = c("executive_summary", "introduction")
)- Whoops! You forgot to add your species name, and now you don’t have a cover image. Run
create_template()with the argumentrerender_skeleton = TRUE, and add your species name (common and scientific names) as two additional arguments: “Petrale sole” (Eopsetta jordani).
Answer:
asar::create_template(
  rerender_skeleton = TRUE,
  species = "Petrale sole",
  spp_latin = "Eopsetta jordani",
  file_dir = file.path("report")
)
Summary (10 mins)
You should now be able to
- Create and fill in a report template
- Understand how to use parameters and key quantities within text
- Understand the format of a standard output object
- Know how to customize a report
Final Reminders
- Feel free to practice some more tonight and come tomorrow with any questions you may have.