Plot patterns in composition residuals by bin or year
Source:R/plot_composition_diagnostics.R
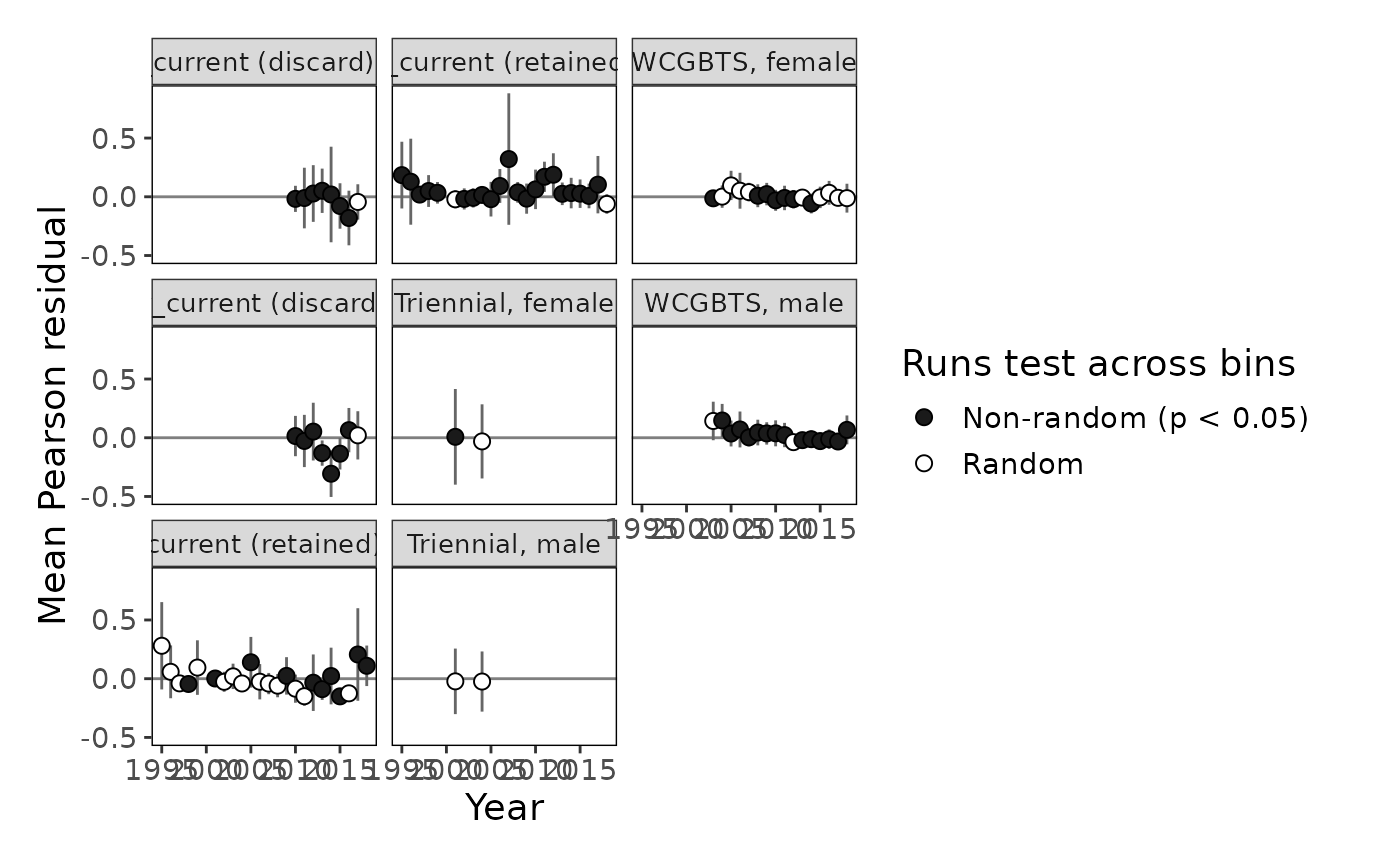
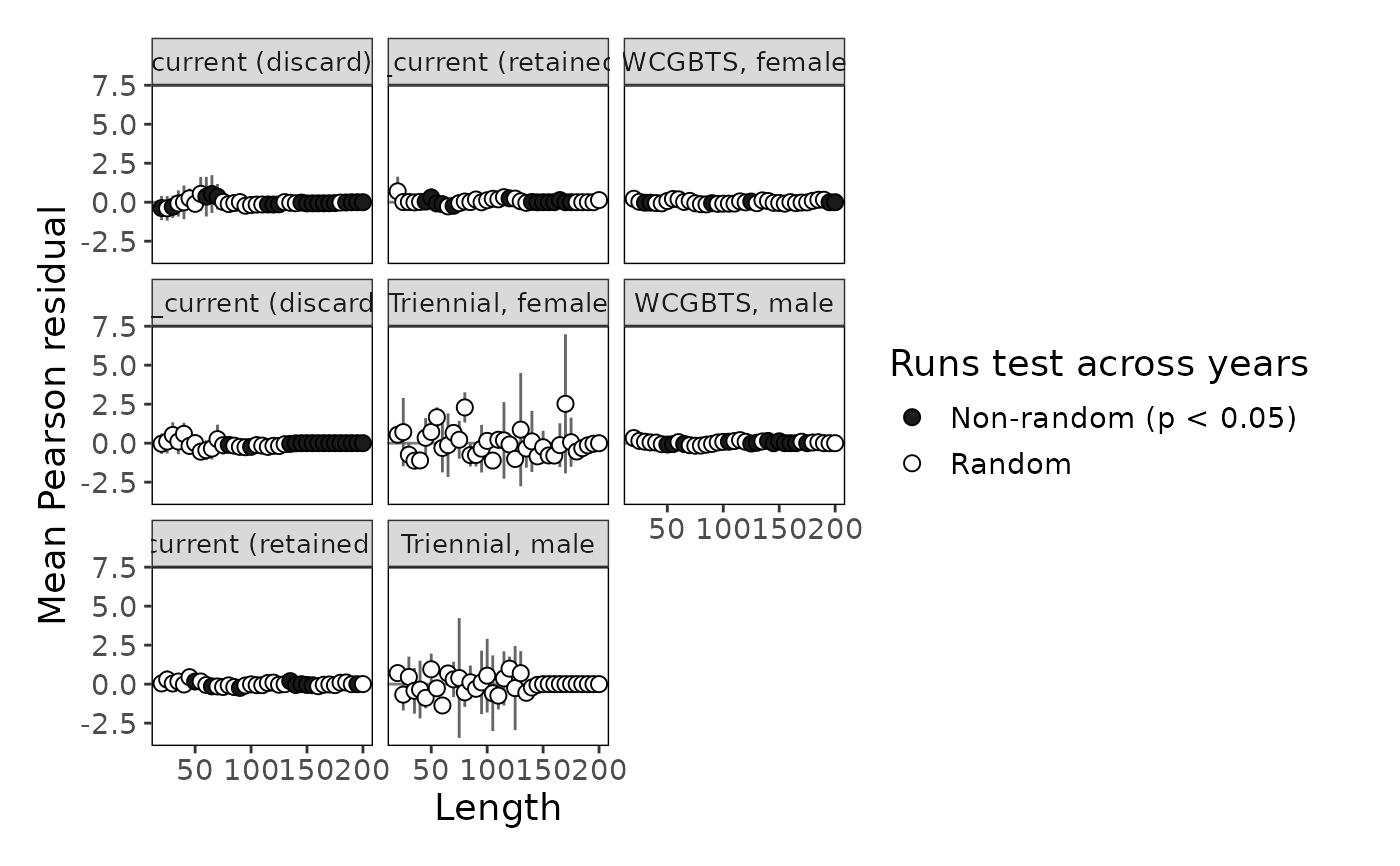
plot_composition_residual_pattern.RdPlot the mean Pearson residual for each bin (across years) or each year (across bins), with a runs test for non-random patterns in the signs of the residuals. These plots summarize the stripes that can appear in residual bubble plots, for example, consistently negative residuals at older ages caused by mis-specified selectivity.
plot_composition_residual_pattern(
  dat,
  by = c("bin", "year"),
  comp_type = NULL,
  fleet = NULL,
  ncol = NULL,
  direction = "v"
)
Arguments
- dat
A tibble returned from
convert_output()that contains composition data (see bigskate_lencomp), or composition data in any other format accepted byprepare_composition_data().- by
String. Summarize residuals by "bin" (age or length) or by "year". Default: "bin"
- comp_type
String. Type of composition to keep when
datcontains more than one. Options: "age", "length", or NULL (keep all). Default: NULL- fleet
Character or numeric vector. Fleet(s) to keep, matching either the fleet name (e.g., "Fishery_current") or the fleet name with its partition (e.g., "Fishery_current (retained)"). NULL keeps all fleets. Default: NULL
- ncol
Number. Number of facet columns. NULL lets
ggplot2choose. Default: NULL- direction
String. Order of the panels: "v" fills panels down each column and then across, so consecutive years are stacked vertically and cohorts are easier to follow from panel to panel; "h" fills panels across each row.
Default: "v"
Value
A ggplot2 object.
Details
Vertical lines are plus and minus two standard errors of the mean
residual. The runs test (Wald-Wolfowitz) is applied to the signs of the
residuals ordered by year (when by = "bin") or by bin (when
by = "year"). Filled points have fewer runs than expected by chance
(one-sided p < 0.05), which indicates a non-random pattern of residuals.
When all residuals have the same sign, the p-value is the probability of
that happening by chance, \(2 \times 0.5^n\).
Residuals are summarized separately for each fleet and sex.
See also
Examples
plot_composition_residual_pattern(bigskate_lencomp)
 plot_composition_residual_pattern(bigskate_lencomp, by = "year")