Standardizing Assessment Model Output
Source:vignettes/convert_output_details.Rmd
convert_output_details.RmdBackground
This article describes the process behind developing the
asar::convert_output function and its setup so users who
want to use asar or stockplotr are still able
until convert_output.R
includes functionality for other models.
Additionally, after following this article, users who use it to manipulate their assessment model output are encouraged to submit a pull request or issue to use as an example to include in the function. This collaboration will not only allow us to expand the converter to include many assessment models, but also do it much faster.
The converter was designed so that it would manipulate the output file from the assessment (Report.sso for SS3, .rdat from BAM…). This means that we have only configured it to work with a singular output file so the converted data frame is limited to the data given to it from that file. We have plans to expand upon this format to include other data files associated with running the model, but this will not happen in the near future.
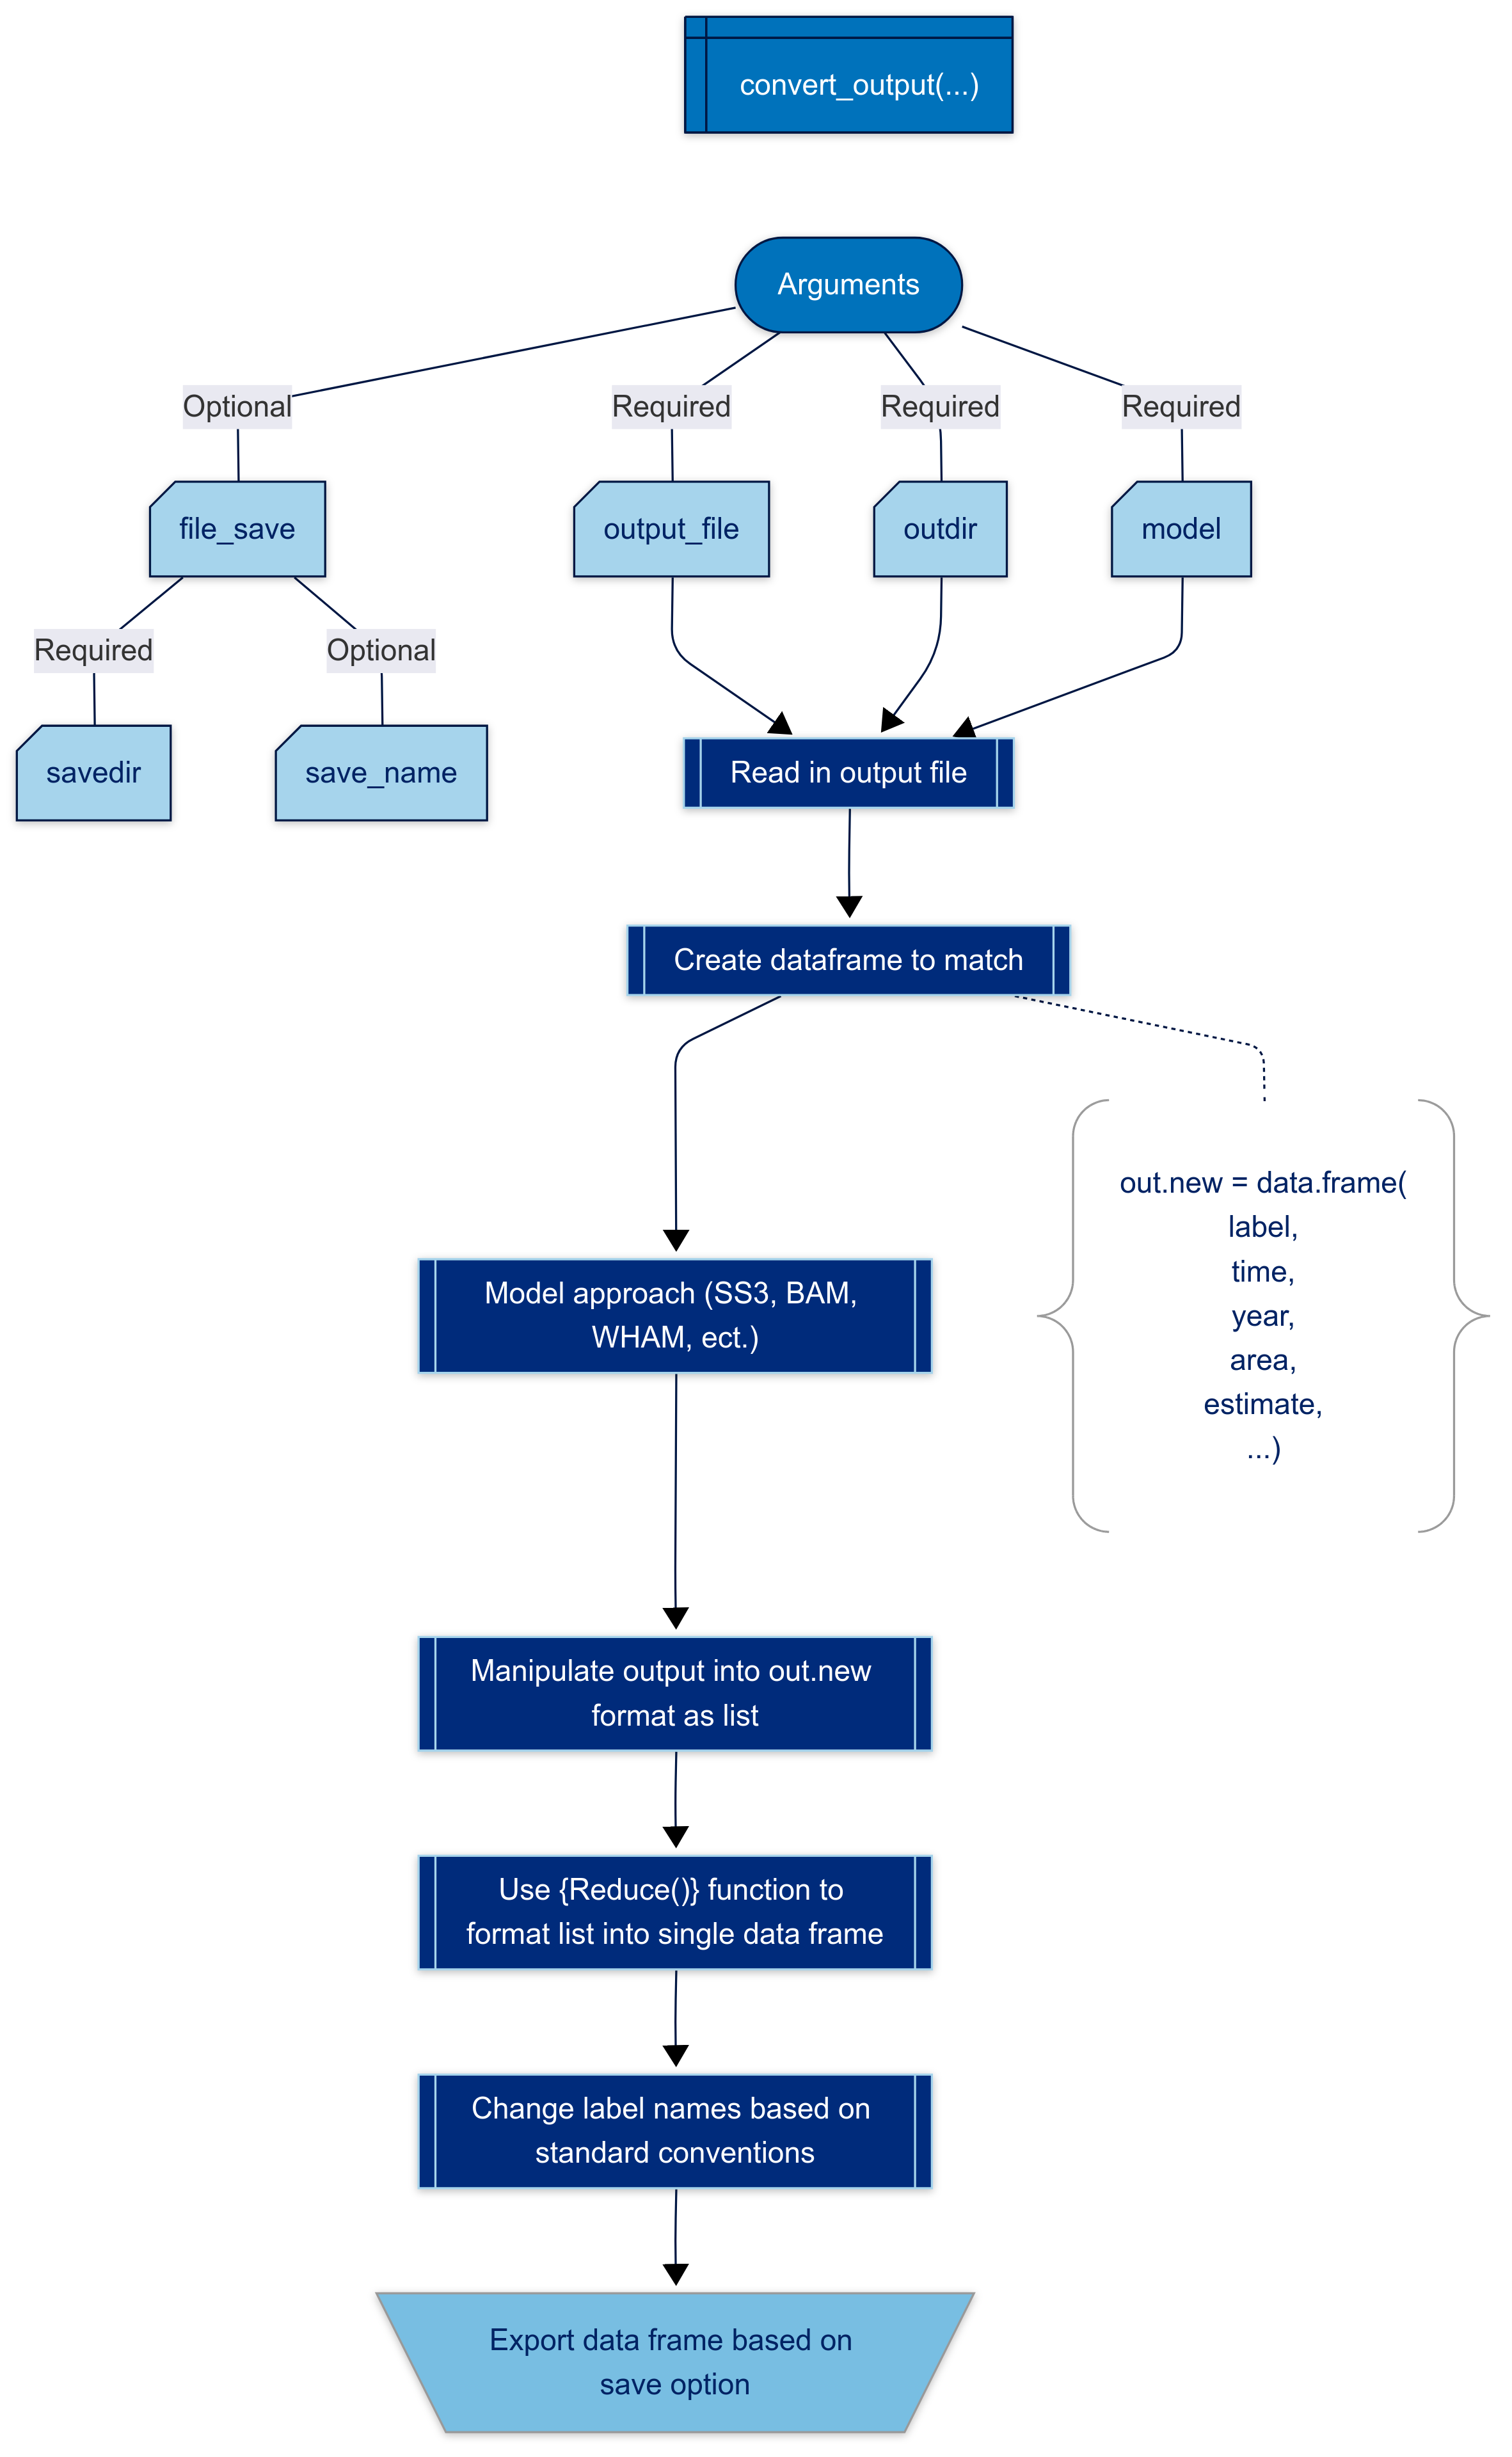
Set up and format
The converter manipulates data sets by recognizing patterns based on the assessment model (SS3, BAM, etc.) and organizes it by expanding all data as single columns. This makes the data frame more machine readable allowing users to plot the data or place it into tables. The format also helps us as developers create other standardized procedures and automation due to its ease of use.
The data is manipulated to follow the format in @tbl-cols. The majority of the code in the
function is specific for how one would manipulate the output with the
following exceptions. The code in the converter creates an empty data
frame with the columns referenced in @tbl-cols (See code).
At the end of the function, standard naming conventions are applied to
rename labels of parameters or quantities as followed in @sec-namecon. Currently, we have files to use as
examples to change the names of labels following our convention. One of
the example files can be downloaded here.
The final data frame is exported to the user’s environment as an object,
if it is assigned an object name (e.g.,
my_converted_output <- convert_output(...)).
##              label estimate year fleet  sex area growth_pattern
## 1 spawning_biomass  2017090 2016    NA <NA>   NA             NA
## 2 spawning_biomass  2286740 2017    NA <NA>   NA             NA
## 3 spawning_biomass  1972500 2018    NA <NA>   NA             NA
## 4 spawning_biomass  1633220 2019    NA <NA>   NA             NA
## 5 spawning_biomass  1509990 2020    NA <NA>   NA             NA
## 6      recruitment  2251210 2016    NA <NA>   NA             NA
##          module_name uncertainty_label uncertainty time season subseason age
## 1 DERIVED_QUANTITIES              <NA>          NA   NA     NA        NA  NA
## 2 DERIVED_QUANTITIES              <NA>          NA   NA     NA        NA  NA
## 3 DERIVED_QUANTITIES              <NA>          NA   NA     NA        NA  NA
## 4 DERIVED_QUANTITIES              <NA>          NA   NA     NA        NA  NA
## 5 DERIVED_QUANTITIES              <NA>          NA   NA     NA        NA  NA
## 6 DERIVED_QUANTITIES              <NA>          NA   NA     NA        NA  NA
##   len_bins initial likelihood gradient estimated bio_pattern birthseas
## 1       NA      NA         NA       NA        NA          NA        NA
## 2       NA      NA         NA       NA        NA          NA        NA
## 3       NA      NA         NA       NA        NA          NA        NA
## 4       NA      NA         NA       NA        NA          NA        NA
## 5       NA      NA         NA       NA        NA          NA        NA
## 6       NA      NA         NA       NA        NA          NA        NA
##   settlement morph type factor platoon month sexes part bin kind nsim age_a
## 1         NA    NA <NA>     NA      NA    NA    NA   NA  NA   NA   NA    NA
## 2         NA    NA <NA>     NA      NA    NA    NA   NA  NA   NA   NA    NA
## 3         NA    NA <NA>     NA      NA    NA    NA   NA  NA   NA   NA    NA
## 4         NA    NA <NA>     NA      NA    NA    NA   NA  NA   NA   NA    NA
## 5         NA    NA <NA>     NA      NA    NA    NA   NA  NA   NA   NA    NA
## 6         NA    NA <NA>     NA      NA    NA    NA   NA  NA   NA   NA    NA
The data frame is structured in following the convention of FIMS but removing the use of S4 or S3 data frame classes encouraging a more user friendly set up to start. The following format outlines the standard data frame:
| Column label | Description |
|---|---|
| label | standard name for the estimate/parameter/quantity (cha) |
| estimate | the actual value for the estimate/parameter/quantity |
| module_name | describes the category of data found in the original data - allows us and familiar users to validate the converter is operating correctly and the correct data is being pulled |
| year | year of the data point if applicable otherwise NA |
| uncertainty | uncertainty value (for estimates) |
| uncertainty_label | label for the uncertainty value (i.e. se, sd, cv…) |
| {strata} | a series of additional columns when stratification of the stock is present (fleet, age, time, area, season, sex, growth pattern) |
| likelihood | if present, the likelihood value for the label; typically NA |
| initial | the initial estimate input into the model associated with the label, if applicable |
There are a variety of ways to stratify the stock. The current converter is built to recognize the following:
- month
- fleet
- fleet_name
- age
- time
- area
- season
- subseason
- sex
- sexes (only if indicating difference from above)
- growth_pattern / gp
- len_bins (length bins for length-at-age models or related length series outputs)
- birthseas
- settlement
- morph
- type
- platoon
- part
- bin
- kind
- nsim
- age_a
Notes:
NA is present in any of the above columns if there isn’t an occurrence from the original assessment model output
Era was removed as a factor from SS3 converted output files since this is something that could be assumed due to the set up of the data
Naming Conventions
Another hurdle to tackle is naming conventions. We have attempted to create a standard naming convention system so that the same values are called each time no matter the assessment model. Unfortunately, this can’t be perfect, but there are approaches we took to standardize naming as best as we could. In terms of naming:
- Generally, labels and other strings are lowercase. Exceptions to this case only include commonly referred to fisheries acronyms such as biomass (B), R0, etc…
- This does not apply to catch and fishing mortality since C and F are used in the R language (a common language used in fisheries). In these two cases, the terms are spelled out in lowercase and string case.
Fleet names are inherited so they are easily called by the analyst familiar with the data.
Labels with more than one word use string case (i.e. spawning_biomass).
The full name is used for the label, unless there is a common and well known acronym for it such as spr, cpue, R0, or it is a point relative to a reference point (i.e. b_msy = , b_b_msy = )
For labels specific to a stock or assessment model, they were kept in the converted output, but edited/expanded upon following the above conventions.
In cases where a label could not be standardized, the same label was kept in the converted output. We hope that these remaining names can be standardized in the future through collaboration with the respective analysts using them.
Final Formatting
convert_output()
exports data frames as a csv. While this is not necessary to the
function of {asar} and {stockplotr} packages as a whole due to their
setup, we recommend continuing this practice to remain consistent with
the function.
UPDATE: we no longer offer the option to save the data frame as a csv. This was removed in a current version of {asar}. We now recommend either converting each time you want the data frame in your environment or save as desired. The function does not take long to run, but can take a long time to save due to its size.
The final data frame does not manipulate column typing (character, numeric, etc.). We have left that to the analyst or other functions since there can be conflicts within the estimates due to NAs. Ideally, all columns beside the following with remain as characters or factors and the following will be converted to numeric:
- estimate
- uncertainty
- initial
- likelihood
In conclusion, the final data frame should be very long with repeating years and factors to represent each point of data from the output file. Some metrics such as estimated stock-recruitment curve, weight-length relationship or other similar parameters are not currently in this function. There are also a number of “keywords” found in the SS3 Report.sso file that are not in the converted output file. We plan to update this in the future, but we prioritized the converter to contain information for plotting.
Helpful Functions to Mainpulate Data
The following functions were used in the convert_output()
function that could be helpful for users replicating it for other
assessment models:
- dplyr::mutate
- dplyr::case_when
- dplyr::inner_join/dplyr::outer_join
- tidyr::pivot_longer/tidyr::pivot_wider
- tidyr::rownames_to_column
- stringr::str_replace
- stringr::str_remove
- stringr::str_extract
- tibble::rowid_to_columns
- tidyselect::any_of/tidyselect::all_of