Plot selectivity
plot_selectivity(
  dat,
  unit_label = "cm",
  group = NULL,
  facet = NULL,
  interactive = TRUE,
  module = NULL,
  make_rda = FALSE,
  figures_dir = getwd(),
  ...
)
Arguments
- dat
Data frame or list. A tibble or named list of tibbles (input as `list()`) returned from convert_output.
If inputting a list of tibbles, the first tibble's reference point defined in `ref_line` is used to plot a reference line or calculate relative spawning biomass.
- unit_label
units for length-based selectivity.
Default: "cm"
- group
String. Single column that groups the data.
Set group = "none" to summarize data over all indexing values.
Default: NULL Options: Including, but not limited to: "year", "area", "fleet", "sex", "none", NULL
- facet
Character vector. Column name or names used for faceting.
Default: NULL
- interactive
Logical. TRUE/FALSE; indicate whether the environment is interactive.
Default: `FALSE`
- module
Character vector. (Optional) Module name found in `dat$module_name`. If selecting >1 module, place them in a vector like c("module1", "module2").
Default: NULL
If the interactive and >1 module_name is found, user will select the module_name in the console. @seealso [filter_data()]
- make_rda
Logical. TRUE/FALSE; indicate whether to save the object and make an automated caption and alternative text in the form of an `rda` object. If TRUE, the rda will be exported to the folder indicated in the argument "figures_dir".
Default: `FALSE`.
- figures_dir
Path. Path to the "figures" folder.
Default: `getwd()`
The folder is created within the path if it does not exist.
- ...
Arguments called from geom_line or geom_point
Value
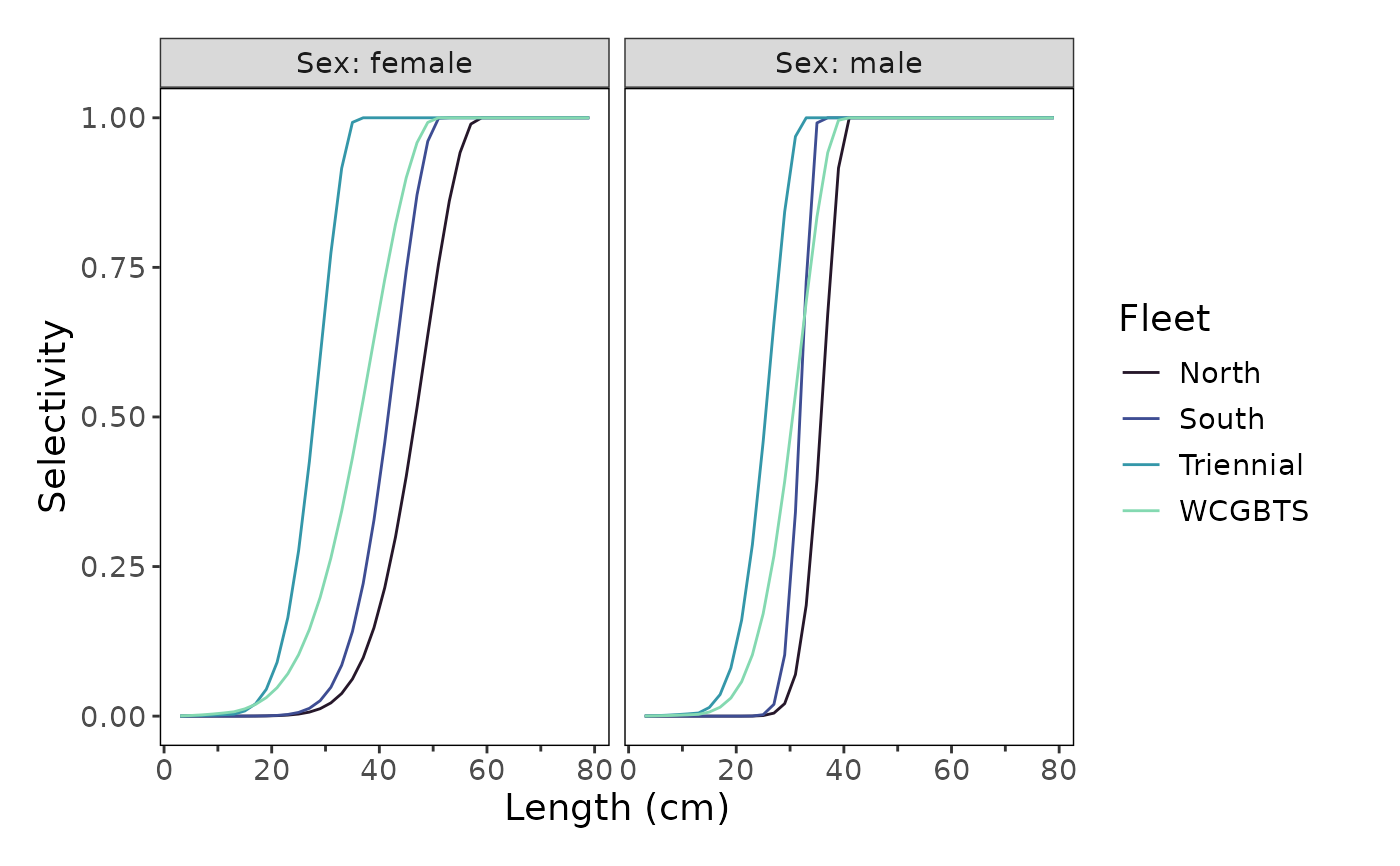
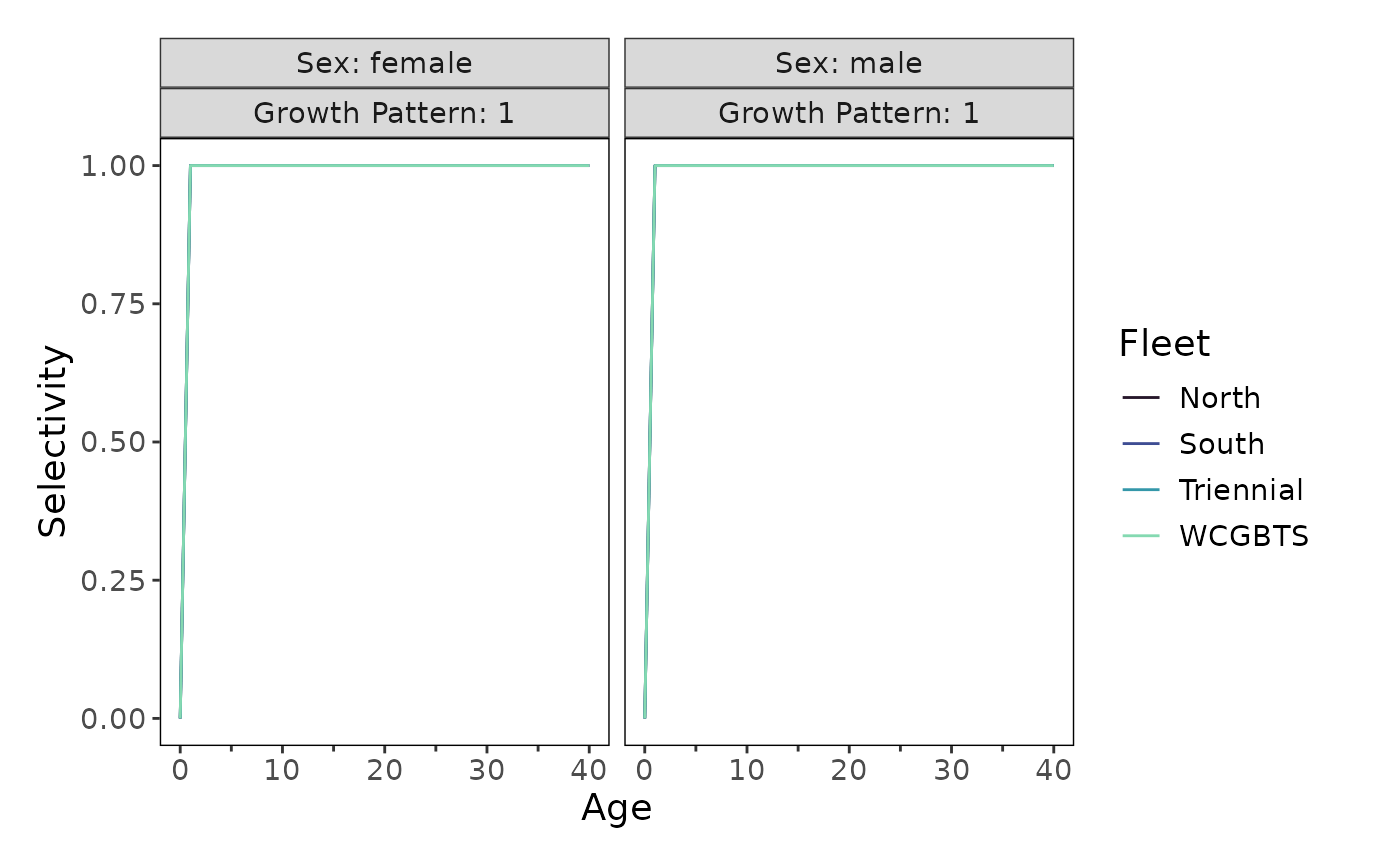
A plot showing selectivity by age or length.
Details
The input is from an assessment model output file translated to a standardized output (convert_output). There are options to return a `ggplot2` object or export an .rda object containing associated caption and alternative text for the figure.
See also
[convert_output()], [filter_data()], [process_data()], [plot_timeseries()], [export_kqs()], [insert_kqs()], [create_rda()]
Examples
plot_selectivity(
dat = stockplotr:::example_data,
interactive = TRUE,
module = "AGE_SELEX",
make_rda = FALSE
)
#> Ignoring unknown labels:
#> • linetype : "Fleet"
#> • shape : "Fleet"
 plot_selectivity(
dat = stockplotr:::example_data,
module = "LEN_SELEX",
make_rda = FALSE
)
#> Ignoring unknown labels:
#> • linetype : "Fleet"
#> • shape : "Fleet"
plot_selectivity(
dat = stockplotr:::example_data,
module = "LEN_SELEX",
make_rda = FALSE
)
#> Ignoring unknown labels:
#> • linetype : "Fleet"
#> • shape : "Fleet"