Plot Index of Abundance
plot_index(
  dat,
  unit_label = NULL,
  group = NULL,
  facet = NULL,
  interactive = TRUE,
  module = NULL,
  focus = NULL,
  interval = 0.95,
  log = FALSE,
  relative = FALSE,
  make_rda = FALSE,
  figures_dir = getwd(),
  ...
)
Arguments
- dat
Data frame or list. A tibble or named list of tibbles (input as
list()) returned from convert_output.If inputting a list of tibbles, the first tibble's reference point defined in
ref_lineis used to plot a reference line or calculate relative spawning biomass.- unit_label
String. Index of abundance/CPUE units, Default: NULL
- group
String. Single column that groups the data.
Set group = "none" to summarize data over all indexing values.
Default: NULL Options: Including, but not limited to: "year", "area", "fleet", "sex", "none", NULL
- facet
Character vector. Column name or names used for faceting. "fleet" is always added on to any faceting selections. Default: NULL Options may include, but is not limited to: "fleet", "year", "area", NULL
- interactive
Logical. TRUE/FALSE; indicate whether the environment is interactive.
Default:
FALSE- module
Character vector. (Optional) Module name found in
dat$module_name. If selecting >1 module, place them in a vector like c("module1", "module2").Default: NULL
If the interactive and >1 module_name is found, user will select the module_name in the console. @seealso
filter_data()- focus
Character vector. Column name or names used to filter data. (i.e. select names of fleets to zoom into the plot). Default = NULL
- interval
Number. Coverage of intervals around the observed index based on its observation error (e.g., 0.95), drawn as vertical lines. NULL draws no intervals. Default: 0.95
- log
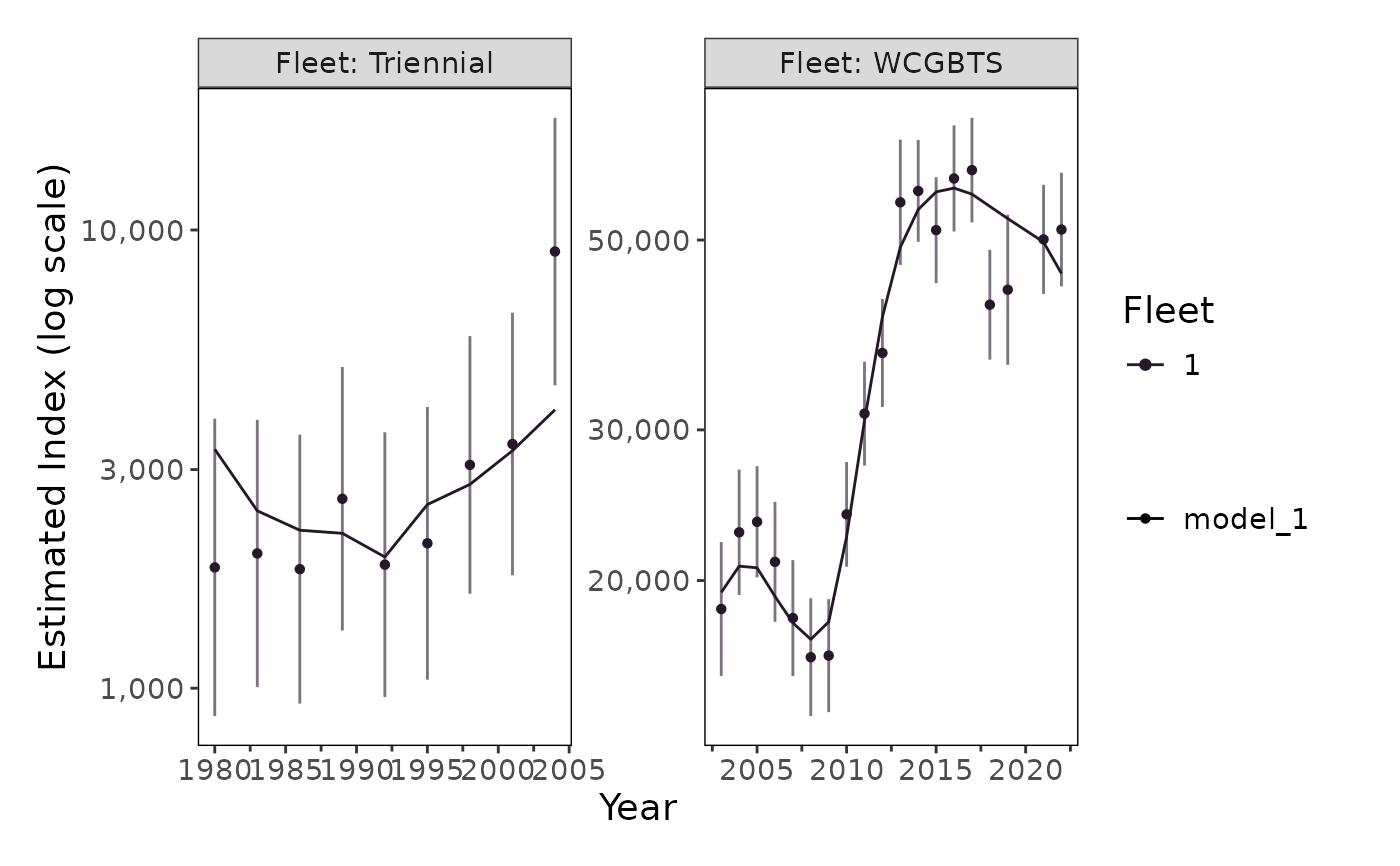
Logical. TRUE/FALSE; plot the index on a log scale. Indices with lognormal errors are often easier to judge on a log scale, where the intervals are symmetric. Default: FALSE
- relative
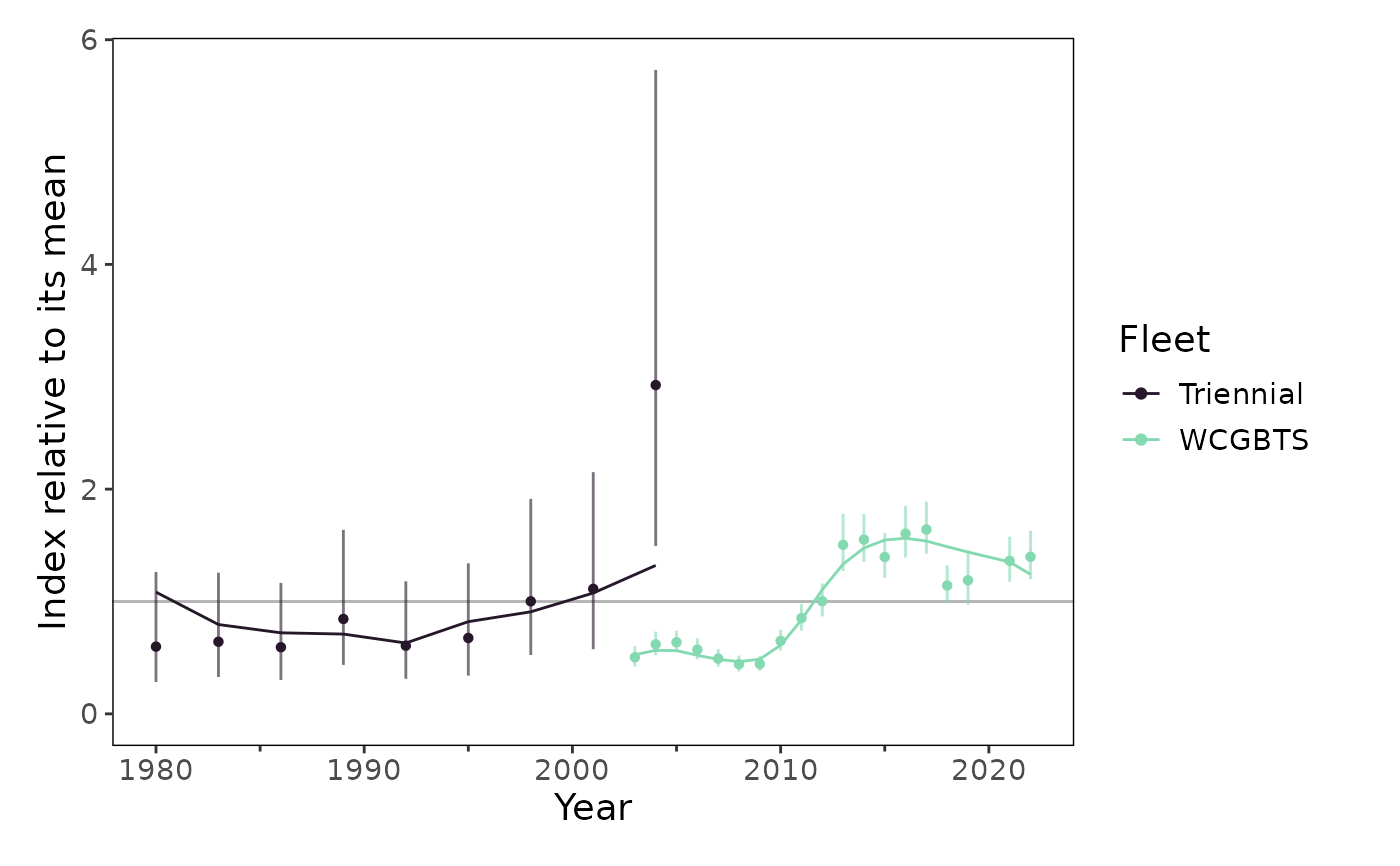
Logical. TRUE/FALSE; divide each fleet's observed and predicted index (and intervals) by the mean of its observed index, and plot all fleets on one panel, colored by fleet. Indices with conflicting trends (data conflicts) are a common cause of poor fits and are easiest to see this way (
r4ss::SSplotIndices()subplot 9). Anygroupother than "fleet" is added tofacet. Default: FALSE- make_rda
Logical. TRUE/FALSE; indicate whether to save the object and make an automated caption and alternative text in the form of an
rdaobject. If TRUE, the rda will be exported to the folder indicated in the argument "figures_dir".Default:
FALSE.- figures_dir
Path. Path to the "figures" folder.
Default:
getwd()The folder is created within the path if it does not exist.
- ...
Arguments called from geom_line or geom_point
Value
A plot showing the expected and predicted index.
Details
Intervals assume lognormal observation errors, as in Stock Synthesis, FIMS, BAM, and Rceattle: \(o \exp(\pm z \cdot \sigma)\), where \(o\) is the observed index and \(\sigma\) is its log-scale standard error. Uncertainty labeled "se", "sd", or "log_sd" is used as \(\sigma\), and a coefficient of variation ("cv") is converted to \(\sigma = \sqrt{\log(1 + CV^2)}\). Observations without an uncertainty have no interval.
Intervals assume lognormal observation errors, as in Stock Synthesis, FIMS, BAM, and Rceattle: \(o \exp(\pm z \cdot \sigma)\), where \(o\) is the observed index and \(\sigma\) is its log-scale standard error. Uncertainty labeled "se", "sd", or "log_sd" is used as \(\sigma\), and a coefficient of variation ("cv") is converted to \(\sigma = \sqrt{\log(1 + CV^2)}\). Observations without an uncertainty have no interval.
The input is from an assessment model output file
translated to a standardized output (convert_output).
There are options to return a ggplot2 object or export an .rda object
containing associated caption and alternative text for the figure.
See also
Examples
plot_index(
dat = stockplotr::example_data,
unit_label = "fish/hr",
interactive = FALSE
)
#> Scale for x is already present.
#> Adding another scale for x, which will replace the existing scale.
 # 95% intervals around the observed index, on a log scale
plot_index(
dat = stockplotr::example_data,
interval = 0.95,
log = TRUE,
interactive = FALSE
)
#> ! No unit label found in the data. Please provide a unit label using the 'unit_label' argument.
#> Scale for x is already present.
#> Adding another scale for x, which will replace the existing scale.
 # All indices relative to their means on one panel
plot_index(
dat = stockplotr::example_data,
relative = TRUE,
interactive = FALSE
)
#> ! No unit label found in the data. Please provide a unit label using the 'unit_label' argument.
#> Scale for x is already present.
#> Adding another scale for x, which will replace the existing scale.