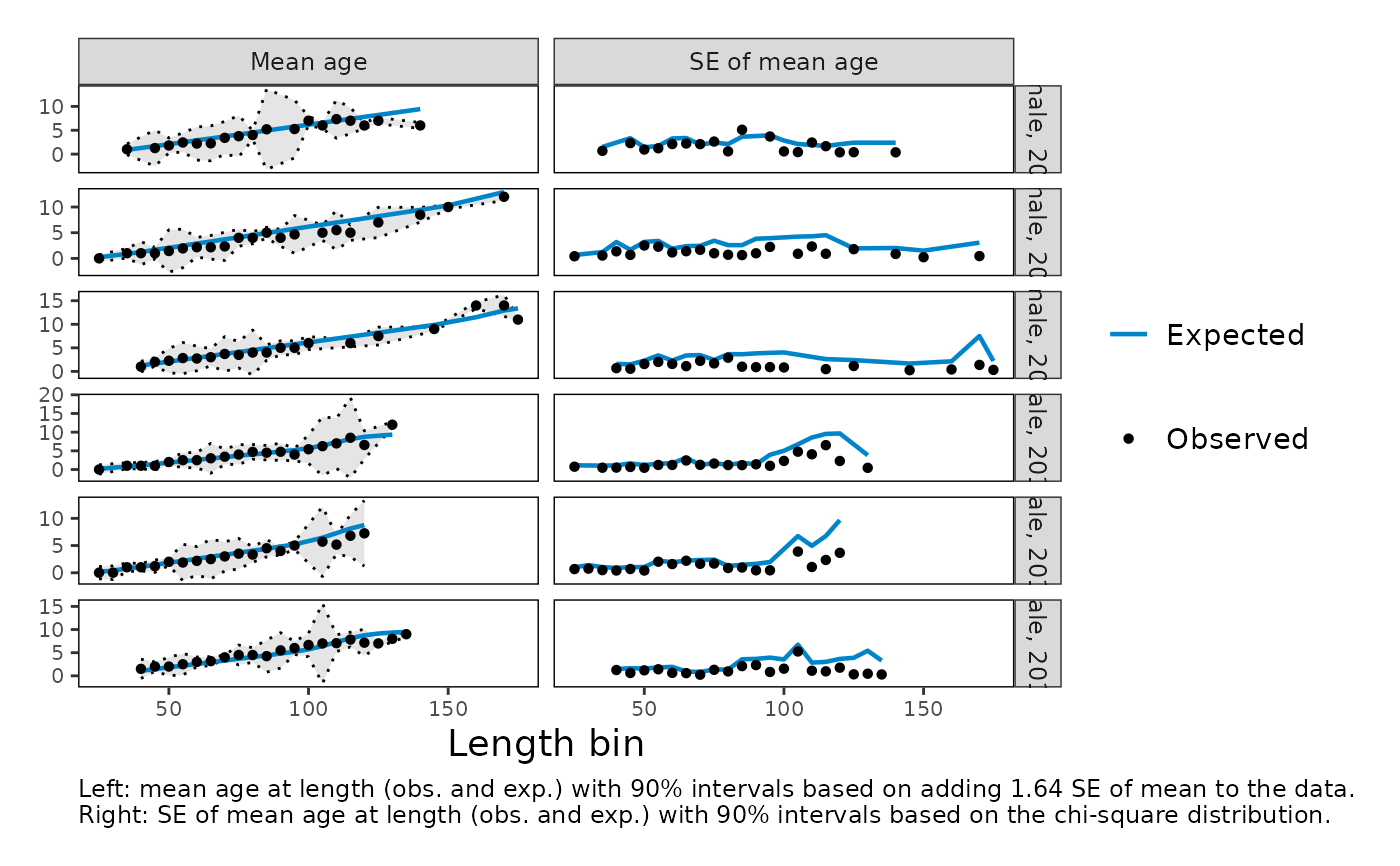
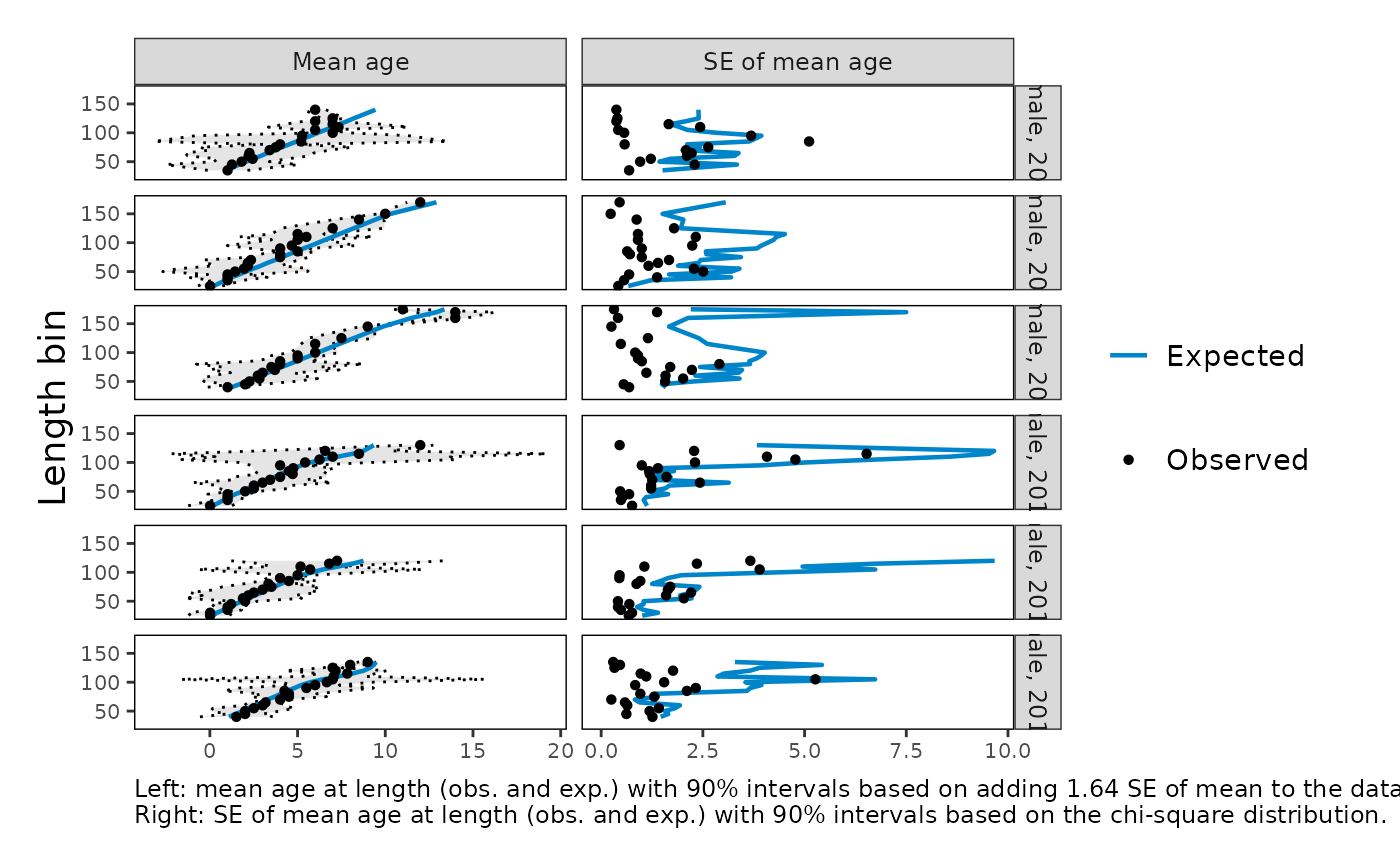
Plot Andre Punt's mean age at length for conditional age-at-length data
Source:R/plot_composition_diagnostics.R
plot_composition_andre.RdFor conditional age-at-length data, plot the observed and expected mean
age in each length bin, and the standard error of the mean age, for each
year. These are "Andre's plots" from r4ss::SSplotComps() (subplot 12).
plot_composition_andre(
  dat,
  interval = 0.9,
  flip = FALSE,
  fleet = NULL,
  ncol = NULL
)
Arguments
- dat
A tibble returned from
convert_output()that contains conditional age-at-length data (see bigskate_caal), or conditional data in any other format accepted byprepare_composition_data()withconditional = TRUE.- interval
Number. Coverage of the intervals around the observed values. Default: 0.90, corresponding to 90% intervals
- flip
Logical. TRUE/FALSE; put age (the mean age or its standard error) on the horizontal axis and length on the vertical axis, as in a growth curve. The default (FALSE) puts length on the horizontal axis, as in r4ss.
- fleet
Character or numeric vector. Fleet(s) to keep, matching either the fleet name (e.g., "Fishery_current") or the fleet name with its partition (e.g., "Fishery_current (retained)"). NULL keeps all fleets. Default: NULL
- ncol
Number. Number of facet columns. NULL lets
ggplot2choose. Default: NULL
Value
A ggplot2 object with one row of panels per year (and per sex
and fleet when there is more than one): mean age at length on the left and
standard error of the mean age on the right.
Details
Within each year and length bin, the observed and expected mean ages are \(\sum_a a\, o_a\) and \(\sum_a a\, e_a\), and the standard errors are the corresponding standard deviations of age divided by \(\sqrt{N}\), where \(N\) is the number of fish aged in the length bin. Following r4ss, the interval for the mean is the observed mean plus or minus the normal quantile times the observed standard error, and the interval for the standard error is based on the chi-square distribution. Observed values outside the intervals, or expected values that consistently differ from the observed values, suggest mis-specified growth or variability in length at age.
The statistics are calculated separately for each sex. Unlike r4ss, which
combines sexes, this avoids jumps in the expected values when the ratio of
sample sizes varies between sexes. Length bins with no observations or no
sample size are omitted. Plot one fleet at a time with fleet, and subset
years by filtering dat.
Equivalent plots in other packages
r4ss: r4ss::SSplotComps() subplot 12 (Andre's plots of
mean age and standard deviation for conditional age-at-length data).