Add NOAA formatting to figure or table
add_theme(x)Value
Add the standard formatting for stock assessment reports for any figure or table. Currently, the function is able to format objects from: ggplot (ggplot2), base r plot, flextable (flextable), gt tables (gt), and kable tables (kableExtra).
Examples
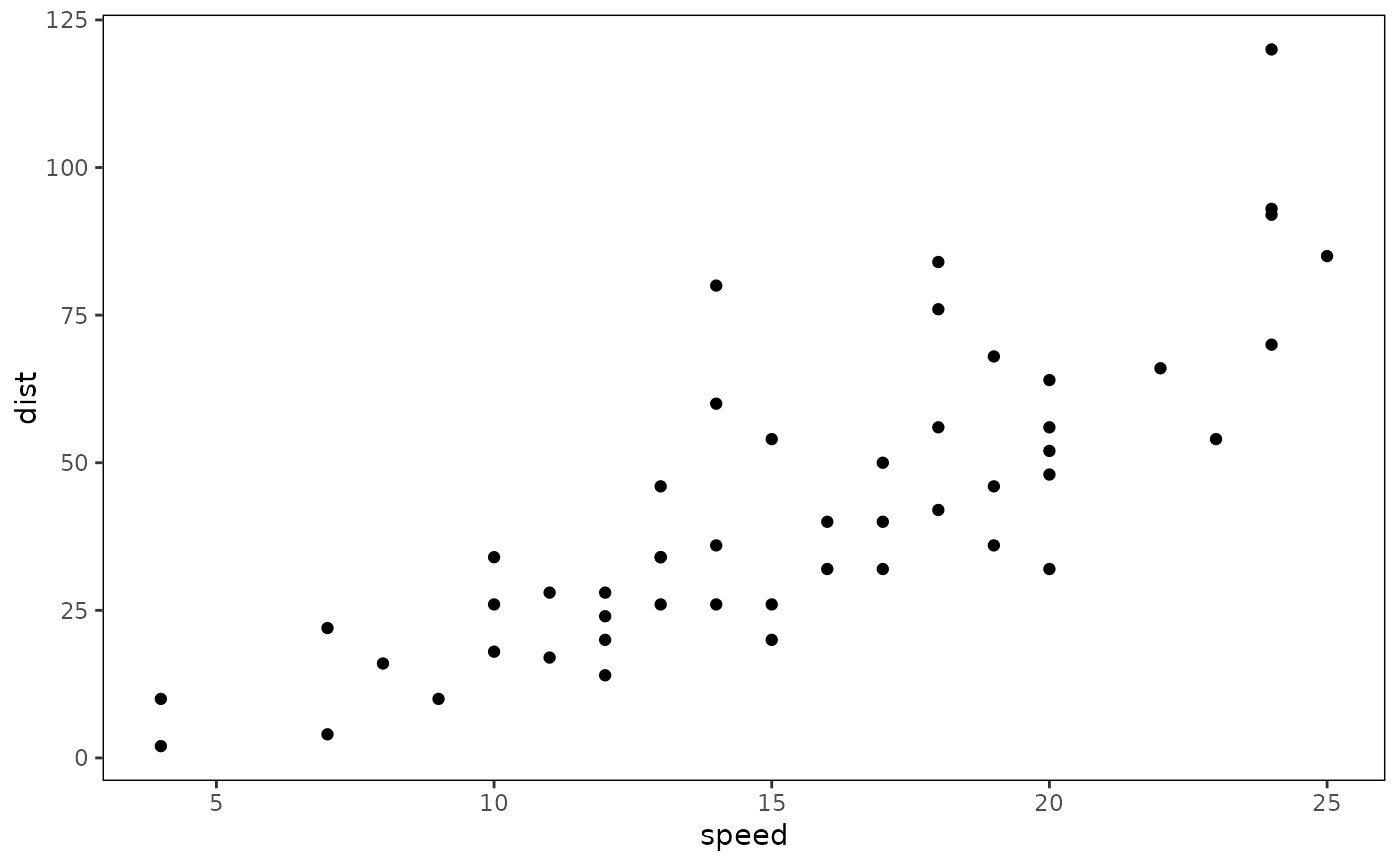
add_theme(ggplot2::ggplot(data = cars, ggplot2::aes(x = speed, y = dist)) +
  ggplot2::geom_point())
