Soundscapes
PAMverse functionality for soundscape analysis provides analysts with a set of easy use standard visualizations to summarize soundscape data and integrate them with environmental or other data streams. These tools are built with standard daily, hybrid milli-decade (HMD) soundscape metric as the expected input. This HMD product can be generated using PyPAM/PBP or MANTA. The Soundscape Explorer shiny app provides a way to interactively view various figures of your own data, apply filters or customizations, and copy the code to recreate that figure in your own analysis script. An overview of the figures currently available and their customizations are included below.
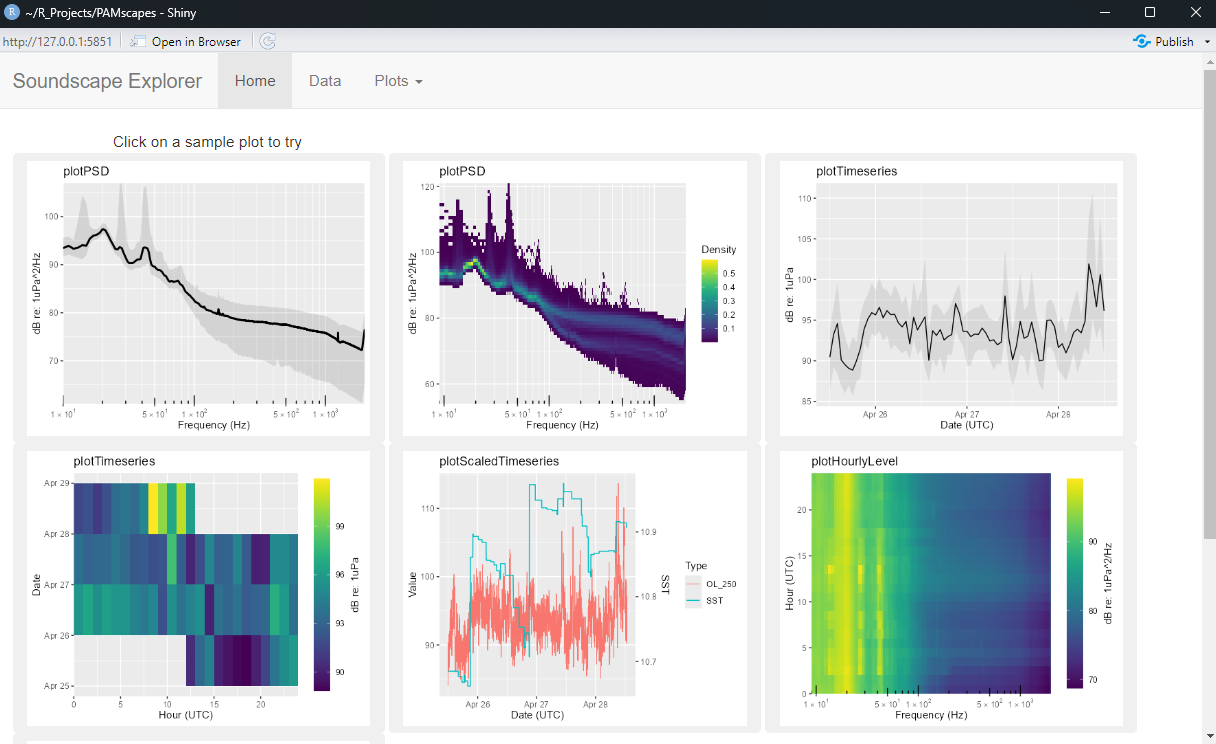
Example figures
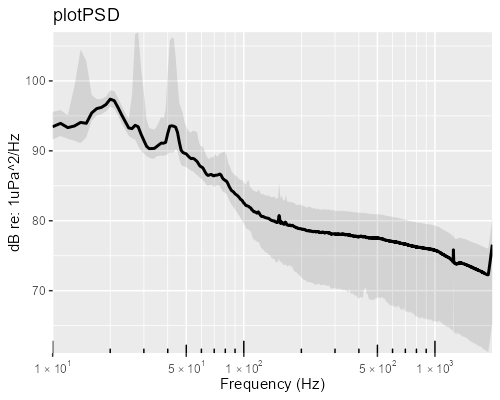
plotPSD provides the median power spectral density for the full time series of data loaded. Customizations include adding specified quantile range or density shading, summarizing by temporal or spatial bins (e.g. hour, month, year, platform), and adding multiple facets by factor category. Additionally, if other categorical data of interest are loaded, this figure can be customized to summarize over other variables, such as environmental variables or presence/absence of a specific sound source.
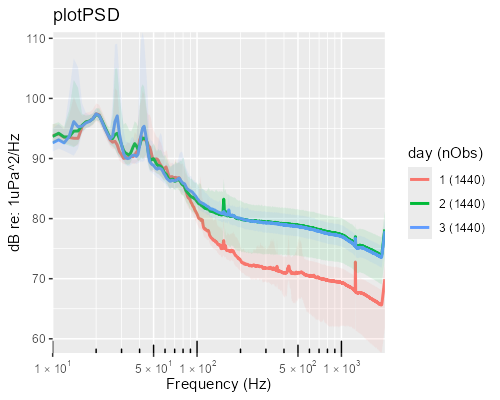
Example customization of the same PSD plot shown above, with median PSD and quantile shading for each day of data visualized.
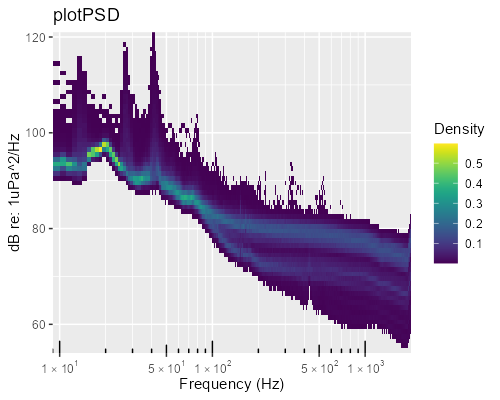
Example customization of the PSD plots shown above, visualizing density rather than a median and quantile range.
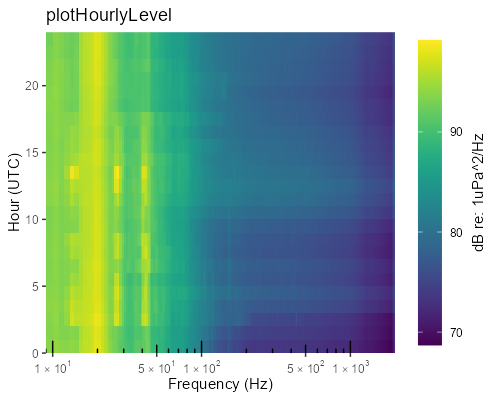
plotHourlyLevel provides a summary of the median SPL for each hour of the day at each frequency. This visualization allows investigation to diel trends over the dataset.
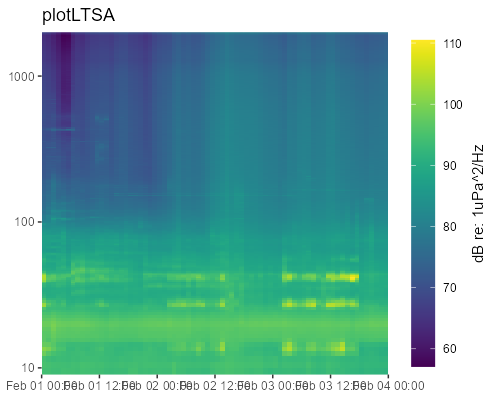
plotLTSA provides a Long-term Spectral Average (LTSA) for the entire dataset loaded.
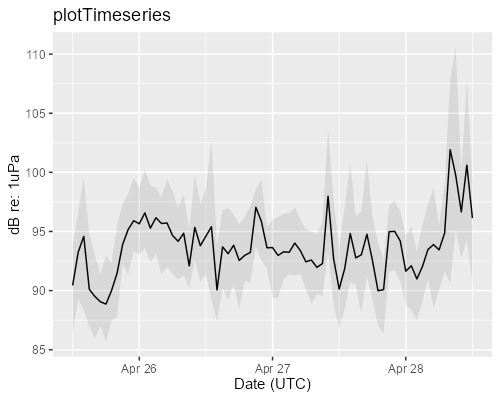
plotTimeseries provides a time series of SPL for a single HMD band of interest with the flexibility to add user specified quantile range shading, compare across multiple platforms, or visualize as a heatmap.
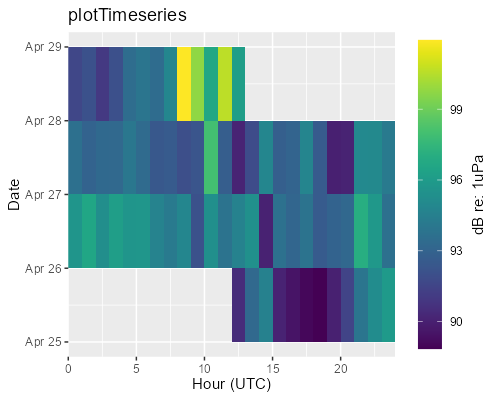
Example customization of the plotTimeseries function above, providing a heatmap of the median hourly SPL of a specified HMD band for each day. This visualization allows investigation of diel patterns over time.
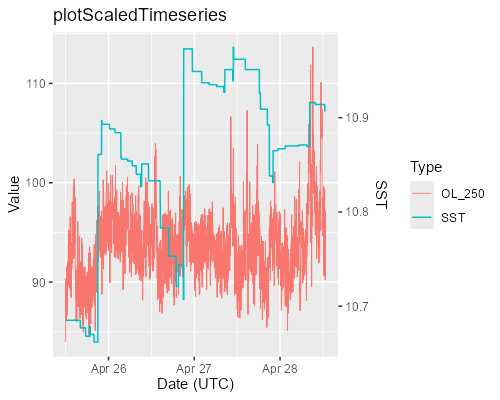
plotScaledTimeseries provides the functionality to examine the timeseries of a single HMD band and a second variable of interest in a scaled figure with two y-axes. The second axis is highly customizable with examples including sea surface temperature or daily monitoring effort.
Demo Script
The most recent PAMverse demo (PAMverse_Demo_20250613) can be found in this folder. It covers the basic usage of the current QAQC, Soundscape, Acoustic Detection, and Integration capabilities in the PAMscapes and PAMmisc packages.