Plot catch composition
plot_catch_comp(
  dat,
  facet = NULL,
  era = "time",
  unit_label = "mt",
  scale_amount = 1,
  proportional = TRUE,
  interactive = TRUE,
  module = NULL,
  make_rda = FALSE,
  figures_dir = getwd()
)
Arguments
- dat
A data frame returned from convert_output
- facet
a string or vector of strings of a column that facets the data. Set facet = "none" to summarize the data in a single plot.
Default: NULL
Options: Including, but not limited to: "year", "area", "fleet", "sex", "none", NULL
- era
A string naming the era of data.
Default: "time"
Options: "early", "time", "fore" (forecast), or NULL (all data)
- unit_label
indicate the name of the units of catch as to label the axis
Default: "mt"
- scale_amount
A number describing how much to scale down the catch at age. Please choose a value ranging from 1-1,000,000,000 (one billion) in orders of magnitude (e.g., 1, 10, 100, 1000, etc.). For example, scale_amount = 100 would scale down a value from 500,000 –> 5,000 and would report catch in hundreds of the 'unit_label'. This scale will be reflected in the legend label if proportional is set to FALSE.
Default: 1
- proportional
Set size of points relative to z when TRUE, point size are relative to one another while when set to FALSE, point size is relative to z
Default: `TRUE`
- interactive
A logical value indicating if the environment is interactive.
Default: `FALSE`
- module
(Optional) A string indicating the module_name found in `dat`. If selecting >1 module, place them in a vector like c("module1", "module2").
Default: NULL
If the interactive and >1 module_name is found, user will select the module_name in the console. @seealso [filter_data()]
- make_rda
TRUE/FALSE; indicate whether to produce an .rda file containing a list with the figure/table, caption, and alternative text (if figure). If TRUE, the .rda will be exported to the folder indicated in the argument "rda_dir".
Default: `FALSE`
- figures_dir
The location of the folder containing the generated .rda files ("rda_files") that will be created if the argument `make_rda` = TRUE.
Default: the working directory (`getwd()`)
Value
A plot showing catch or landings composition.
Details
This plot is made only when catch or landings are explicitly named in the output file. The current plot function does not combine all sources of catch. The input is from an assessment model output file translated to a standardized output (convert_output). There are options to return a `ggplot2` object or export an .rda object containing associated caption and alternative text for the figure.
See also
[convert_output()], [filter_data()], [process_data()], [plot_aa()], [export_kqs()], [insert_kqs()], [create_rda()]
Examples
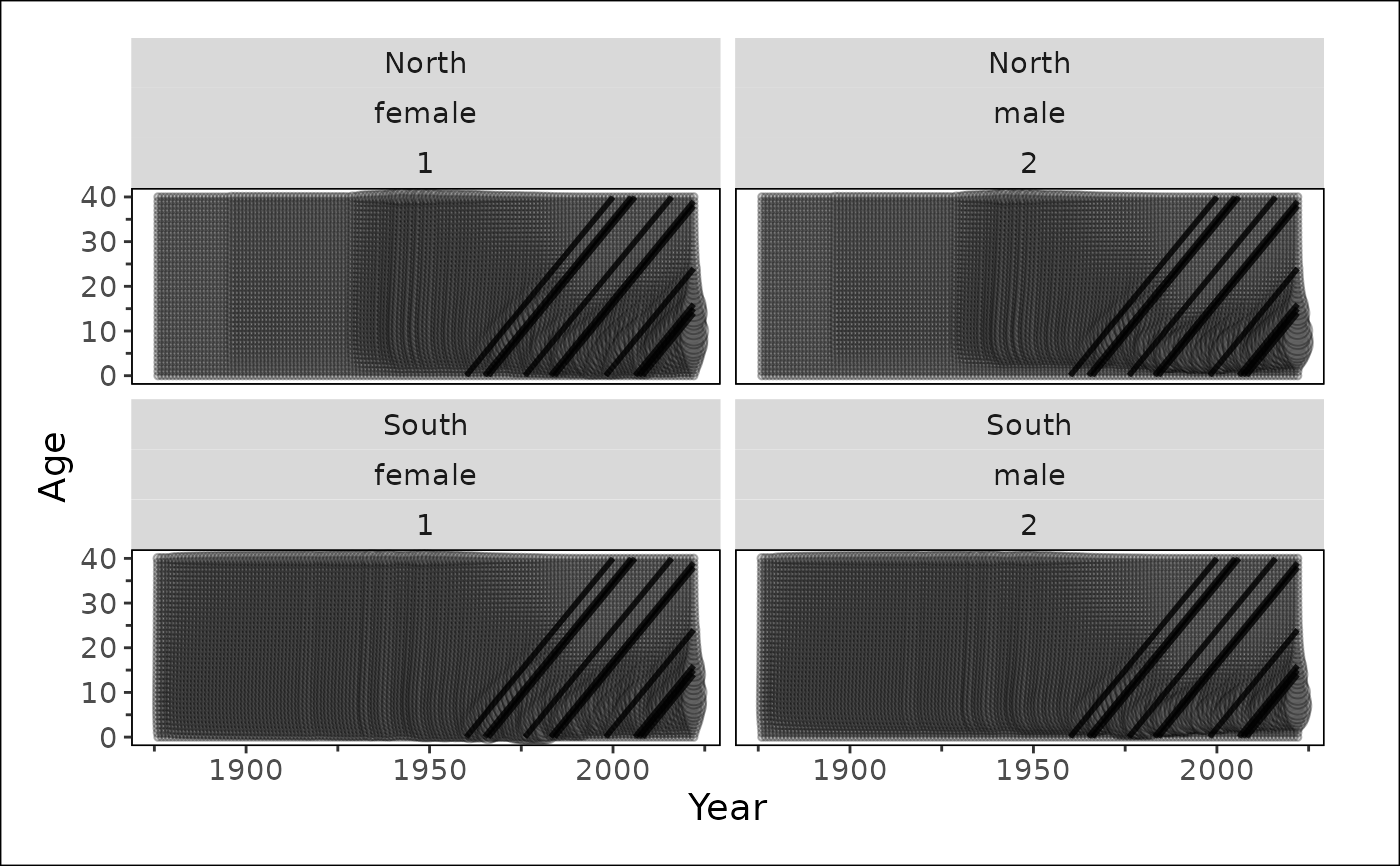
plot_catch_comp(
dat = stockplotr:::example_data,
facet = "fleet",
unit_label = "mt",
scale_amount = 100,
interactive = FALSE,
make_rda = FALSE,
figures_dir = getwd()
)
#> ! Multiple module names found in data.
#> ℹ Environment not interactive. Selecting CATCH_AT_AGE.
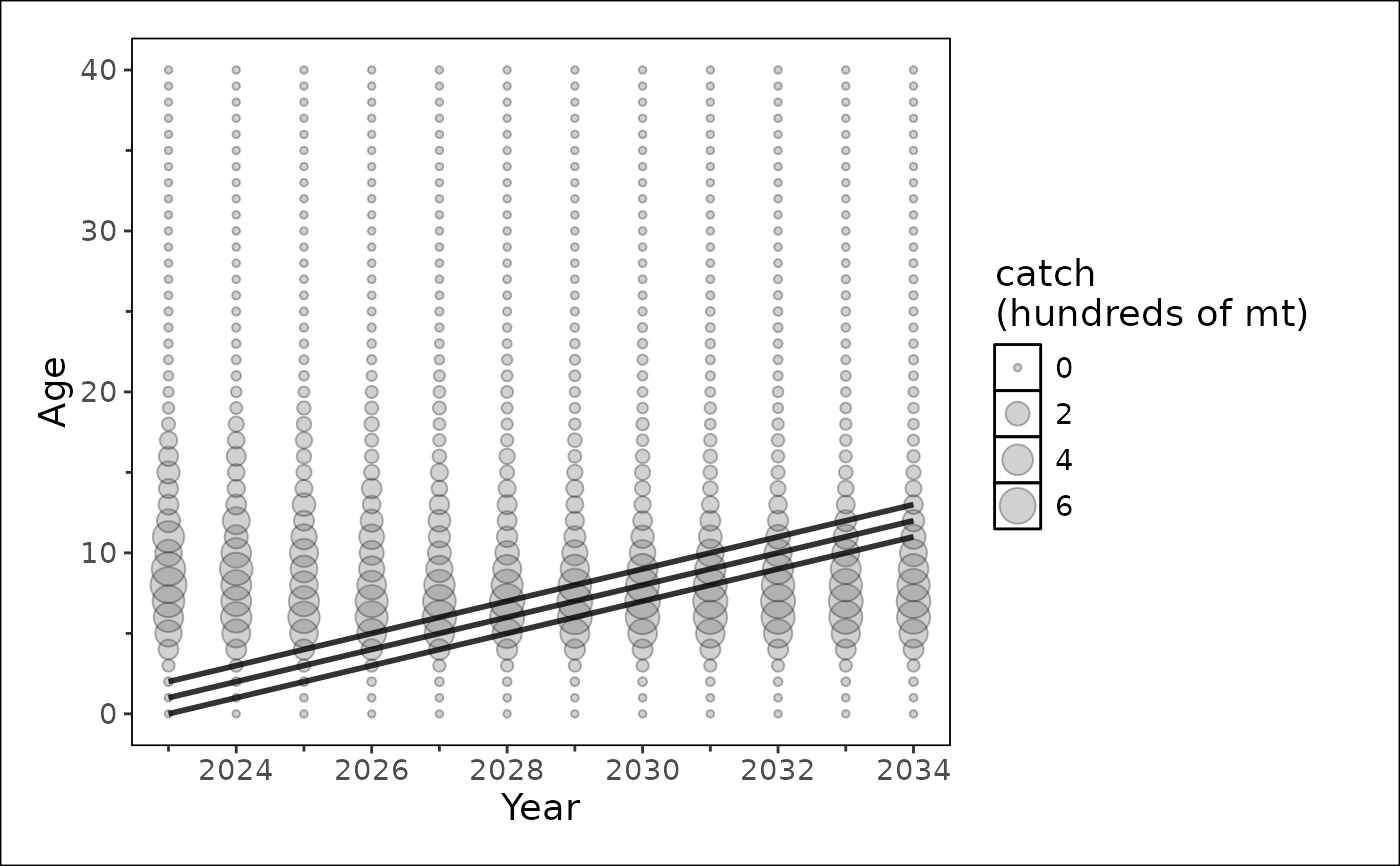
 plot_catch_comp(
dat = stockplotr:::example_data,
facet = "none",
unit_label = "mt",
scale_amount = 100,
interactive = FALSE,
era = "fore",
proportional = FALSE
)
#> ! Multiple module names found in data.
#> ℹ Environment not interactive. Selecting CATCH_AT_AGE.
plot_catch_comp(
dat = stockplotr:::example_data,
facet = "none",
unit_label = "mt",
scale_amount = 100,
interactive = FALSE,
era = "fore",
proportional = FALSE
)
#> ! Multiple module names found in data.
#> ℹ Environment not interactive. Selecting CATCH_AT_AGE.