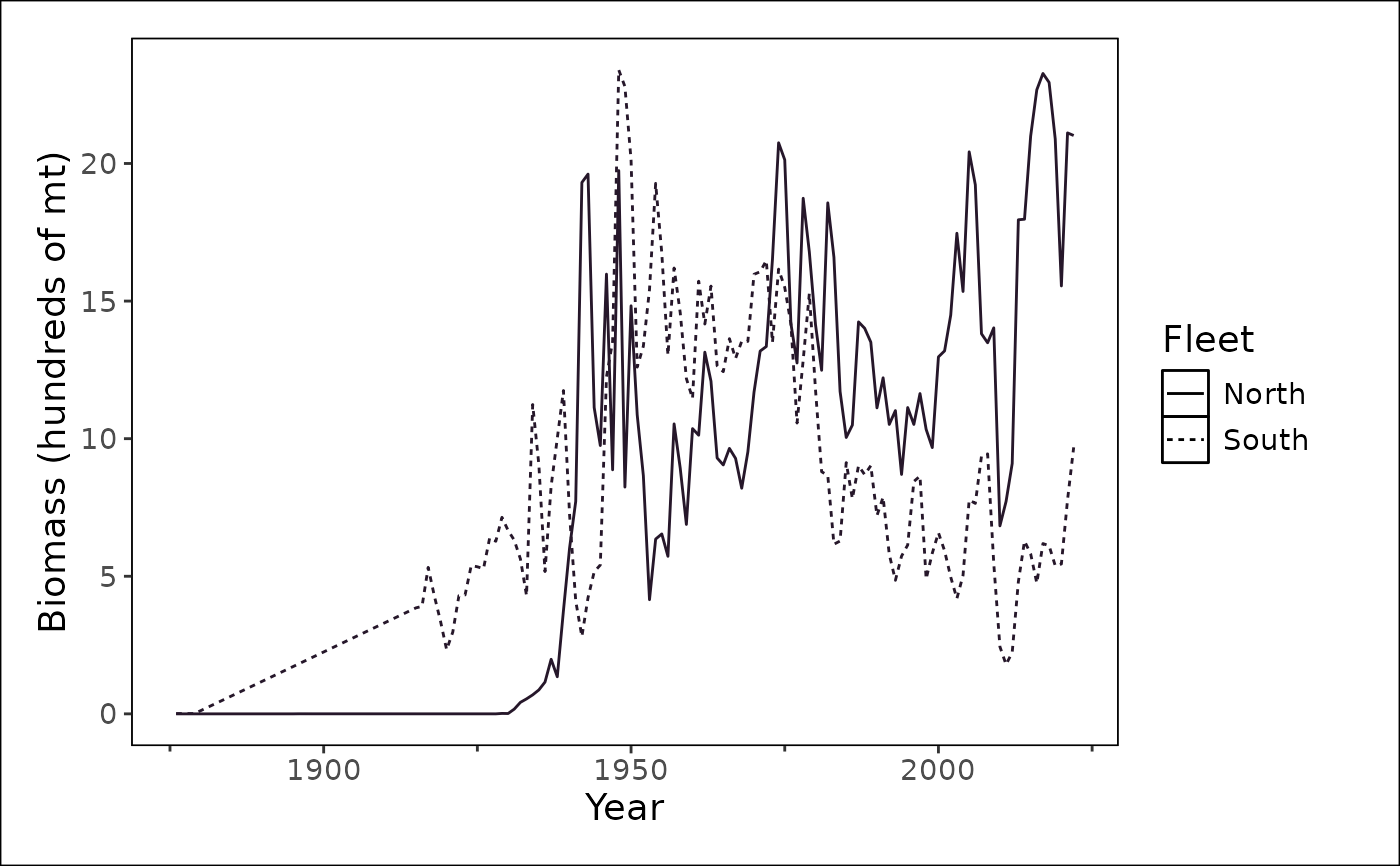
Plot Total Biomass
plot_biomass(
  dat,
  geom = "line",
  group = NULL,
  facet = NULL,
  ref_line = "msy",
  era = NULL,
  unit_label = "mt",
  module = NULL,
  scale_amount = 1,
  relative = FALSE,
  make_rda = FALSE,
  figures_dir = getwd(),
  interactive = TRUE,
  ...
)
Arguments
- dat
Data frame or list. A tibble or named list of tibbles (input as `list()`) returned from convert_output.
If inputting a list of tibbles, the first tibble's reference point defined in `ref_line` is used to plot a reference line or calculate relative spawning biomass.
- geom
String. Geom used for the plot.
Default: "line".
Options: "line", "point", or "area"
- group
String. Single column that groups the data.
Set group = "none" to summarize data over all indexing values.
Default: NULL Options: Including, but not limited to: "year", "area", "fleet", "sex", "none", NULL
- facet
Character vector. Column name or names used for faceting.
Default: NULL
- ref_line
String. Type of reference point to compare biomass to. The default `"msy"` looks for `"biomass_msy"` in the `"label"` column of `dat`. The actual searching in `dat` is case-agnostic and will work with either upper- or lower-case letters. However, you must use one of the options specified in the default list to ensure that the label on the figure looks correct regardless of how it is specified in `dat`.
Default: "msy"
Options: Including, but not limited to: "target", "MSY", "unfished"
- era
String. Era of data.
Default: "time"
Options: "early", "time", "fore" (forecast), or NULL (all data)
- unit_label
String. Biomass units
Default: "mt"
- module
Character vector. (Optional) Module name found in `dat`. If selecting >1 module, place them in a vector like c("module1", "module2").
Default: NULL
If the interactive and >1 module_name is found, user will select the module_name in the console. @seealso [filter_data()]
- scale_amount
Number. A number to scale the y-axis values.
Default: 1
- relative
Logical. TRUE/FALSE; specify whether to set y-axis values relative to the ref_line value.
Default: `FALSE`
- make_rda
Logical. TRUE/FALSE; indicate whether to save the object and make an automated caption and alternative text in the form of an `rda` object. If TRUE, the rda will be exported to the folder indicated in the argument "figures_dir".
Default: `FALSE`.
- figures_dir
Path. Path to the "figures" folder.
Default: `getwd()`
The folder is created within the path if it does not exist.
- interactive
Logical. TRUE/FALSE; indicate whether the environment is interactive.
Default: `FALSE`
- ...
Arguments called from geom_line or geom_point
Value
A plot showing total biomass.
Details
The input is from an assessment model output file translated to a standardized output (convert_output). There are options to return a `ggplot2` object or export an .rda object containing associated caption and alternative text for the figure.
See also
[convert_output()], [plot_timeseries()], [calculate_reference_point()], [reference_line()], [filter_data()], [process_data()], [export_kqs()], [insert_kqs()], [create_rda()]
Examples
plot_biomass(
  dat = stockplotr:::example_data,
  unit_label = "mt",
  ref_line = c("target" = 20000),
  scale_amount = 100,
  module = "TIME_SERIES",
  figures_dir = getwd()
)
#> Ignoring unknown labels:
#> • linetype : "Fleet"
#> • shape : "Fleet"
#> Ignoring unknown labels:
#> • linetype : "Fleet"
#> • shape : "Fleet"

plot_biomass(
  dat = stockplotr:::example_data,
  ref_line = NULL,
  module = "TIME_SERIES",
  figures_dir = getwd()
)
#> Ignoring unknown labels:
#> • linetype : "Fleet"
#> • shape : "Fleet"
plot_biomass(
dat = stockplotr:::example_data,
ref_line = NULL,
module = "TIME_SERIES",
figures_dir = getwd()
)
#> Ignoring unknown labels:
#> • linetype : "Fleet"
#> • shape : "Fleet"
