Incorporating slow-moving recorder data in a species distribution modeling framework
Team: Janelle Gardner, Yvonne Barkley, Devin Johnson, Kaitlin Palmer, Selene Fregosi, Megan Wood (PIFSC)
The SPACIOUS project (Spatial Population Assessment of Cetaceans Integrating acoustic Observations from Uncrewed Systems) aims to develop the analytical framework necessary to integrate PAM data from slow-moving passive acoustic recorders, including underwater gliders and drifting acoustic recorders, into quantitative assessments of population distribution and density. The PAM and UxS SIs are heavily investing in the testing and development of PAM-equipped gliders and this effort will ensure that those developments are more quickly leveraged to improve cetacean assessments. This project will focus on developing a statistical framework that integrates PAM data from underwater gliders and drifters with existing visual-based species distribution models (SDM) to achieve more accurate ensemble models with seasonal context.
Project goals
Identify aspects of spatial models and currenty density estimation methods that need modification/supplementation to incorporate slow-moving data
Conduct simulations and/or experiments to address missing model components
Develop analytical framework with an initial target species
Engage with the PAM glider and modelling communities to assess the state of the science and validate approaches
Project status
Last updated: June 2026
SPACIOUS draws on two glider datasets collected as part of a Pacific-wide effort to operationalize PAM gliders for NMFS cetacean surveys. Both datasets are named for concurrent ship-based visual and acoustic surveys, enabling direct comparisons across data collection methods.
CalCurCEAS (California Current Cetacean and Ecosystem Assessment Survey): Two gliders surveyed the shelfbreak from Newport, OR to Eureka, CA in Fall 2024, covering ~800 km each over 6 weeks (red and yellow lines, left).
WHICEAS (Winter Hawaiian Islands Cetacean and Ecosystem Assessment Survey): Five gliders were deployed around the Main Hawaiian Islands from February–April 2026 for 6–12 weeks, covering up to 1,400 km each. Three will be used in SPACIOUS; SG679 (purple) is excluded due to a memory issue and the Slocum glider (green) due to platform differences.
All gliders carried identical WISPR3 recording systems sampling at 200 kHz. Gliders dove repeatedly to 1,000 m on 5–7 hour cycles, recording at all depths below 10 m — yielding near-continuous acoustic records with only ~10-minute gaps at the surface.
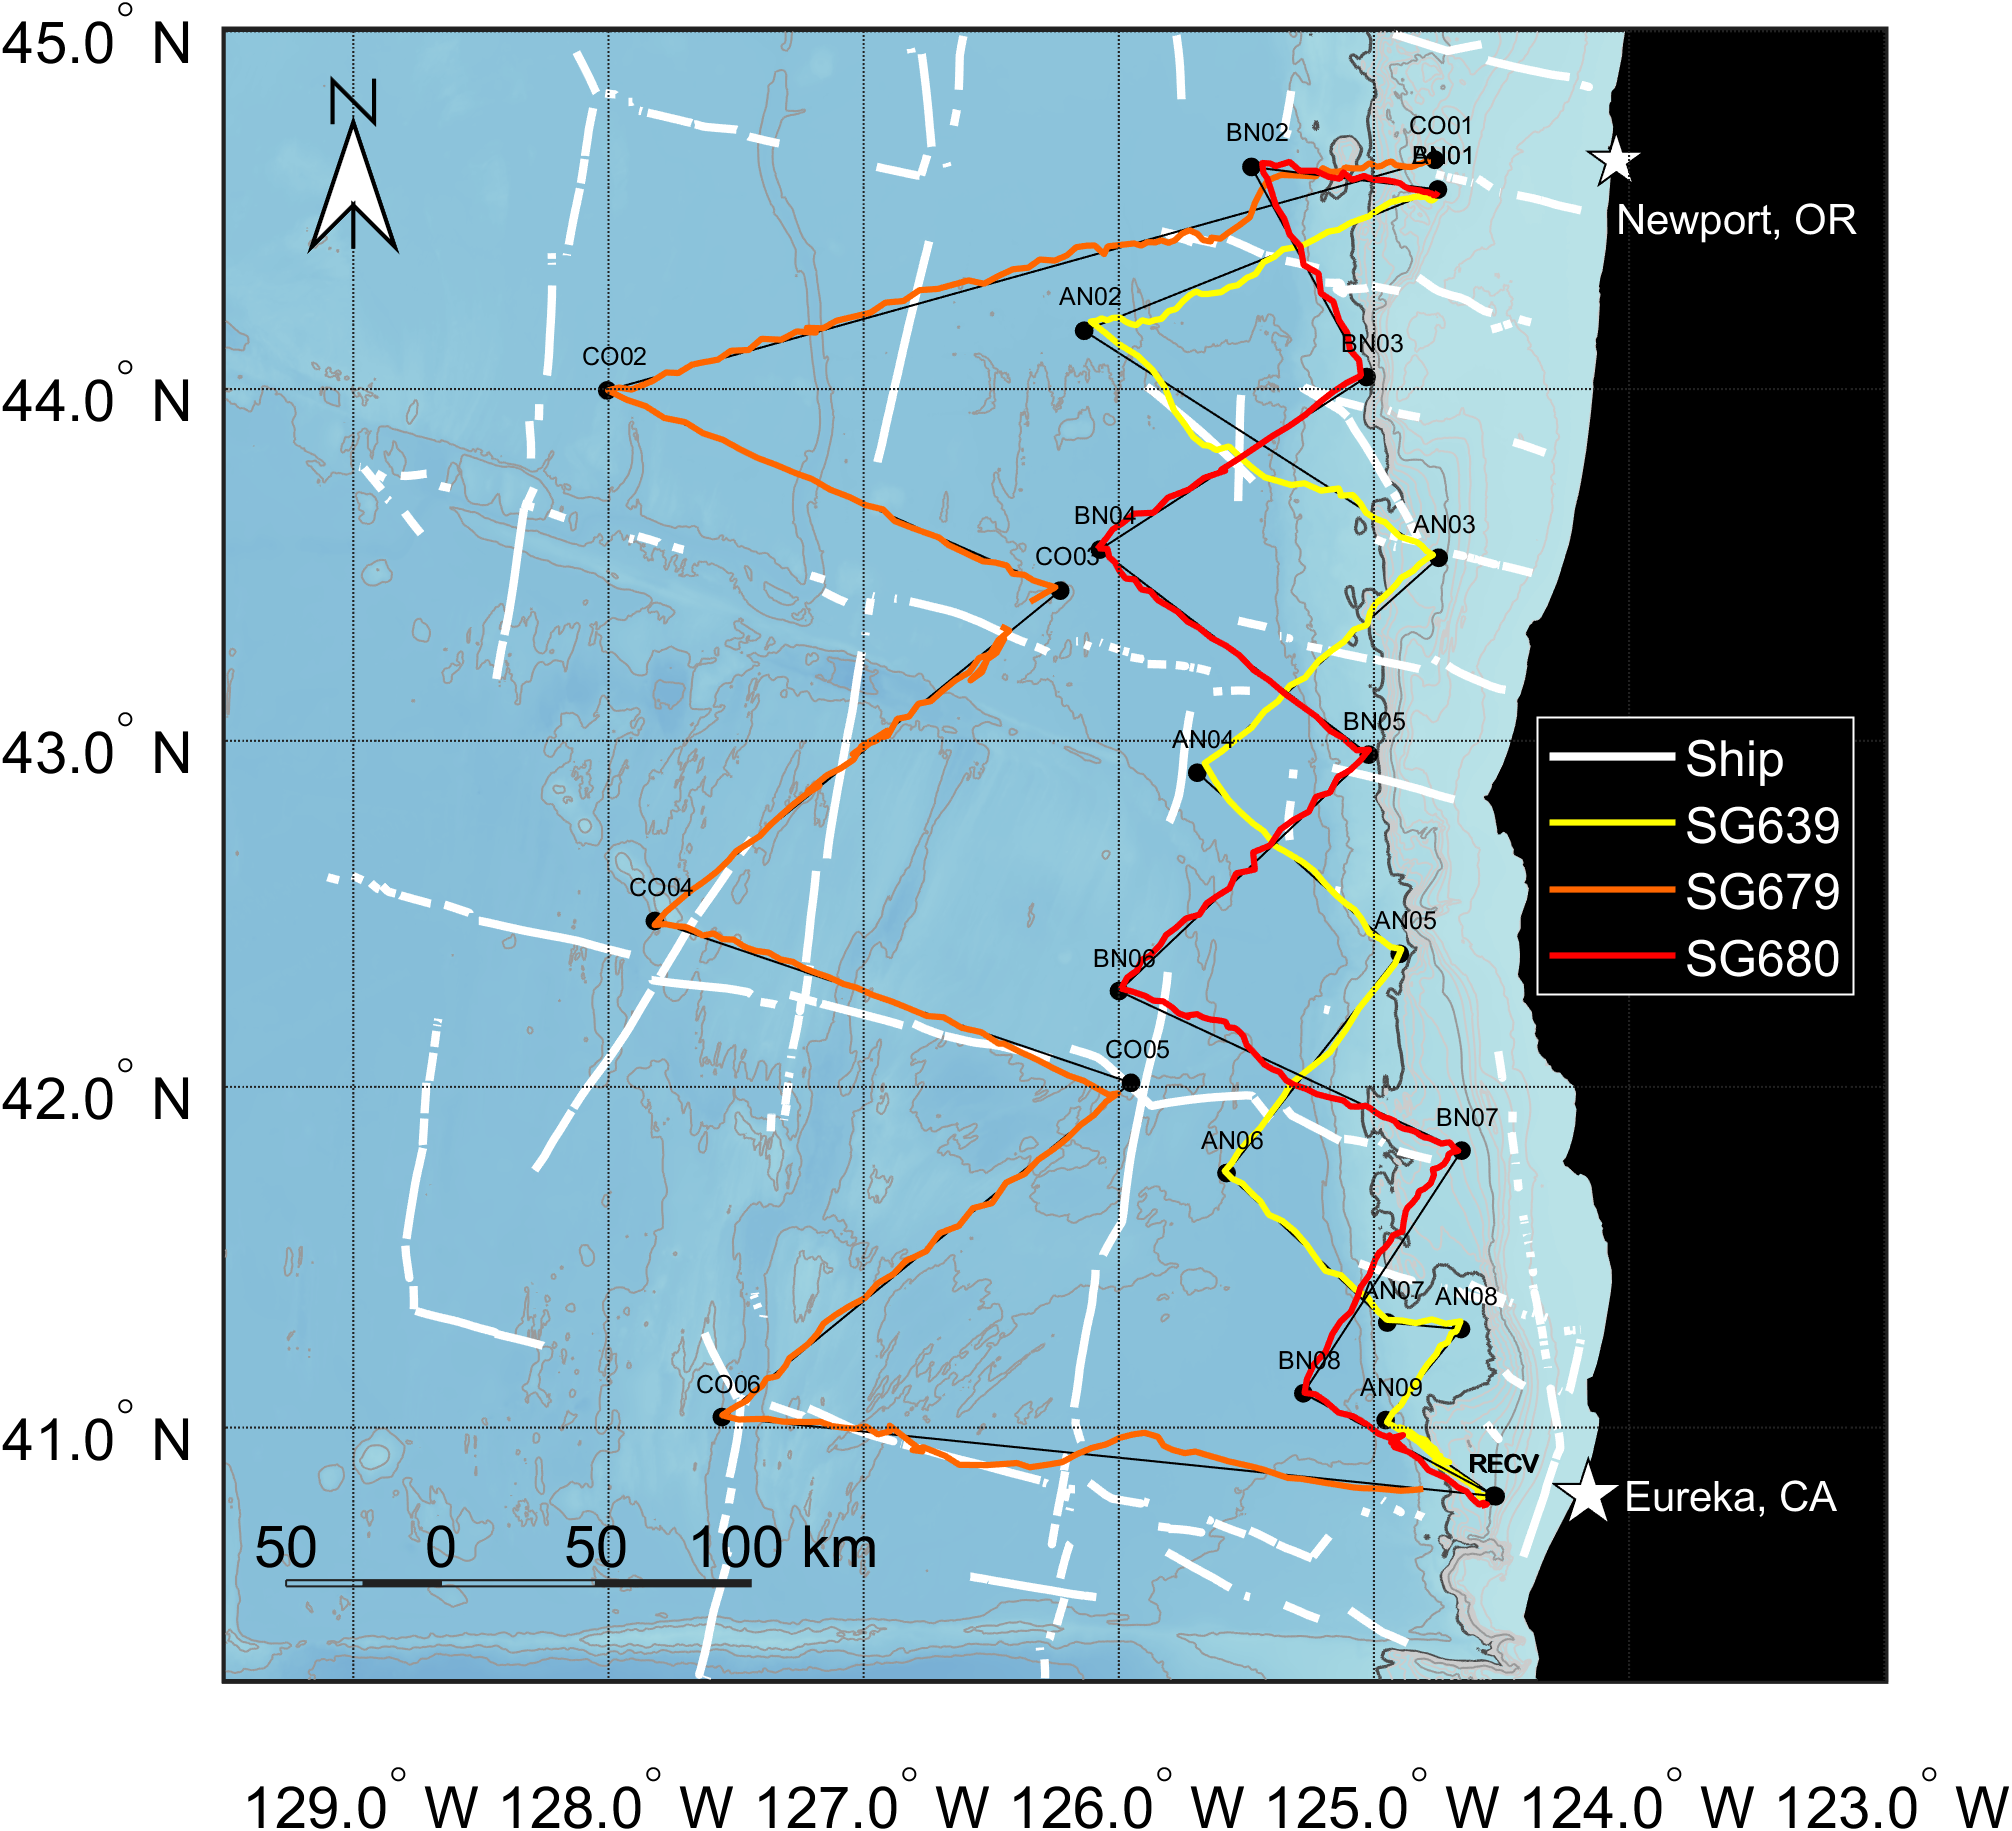
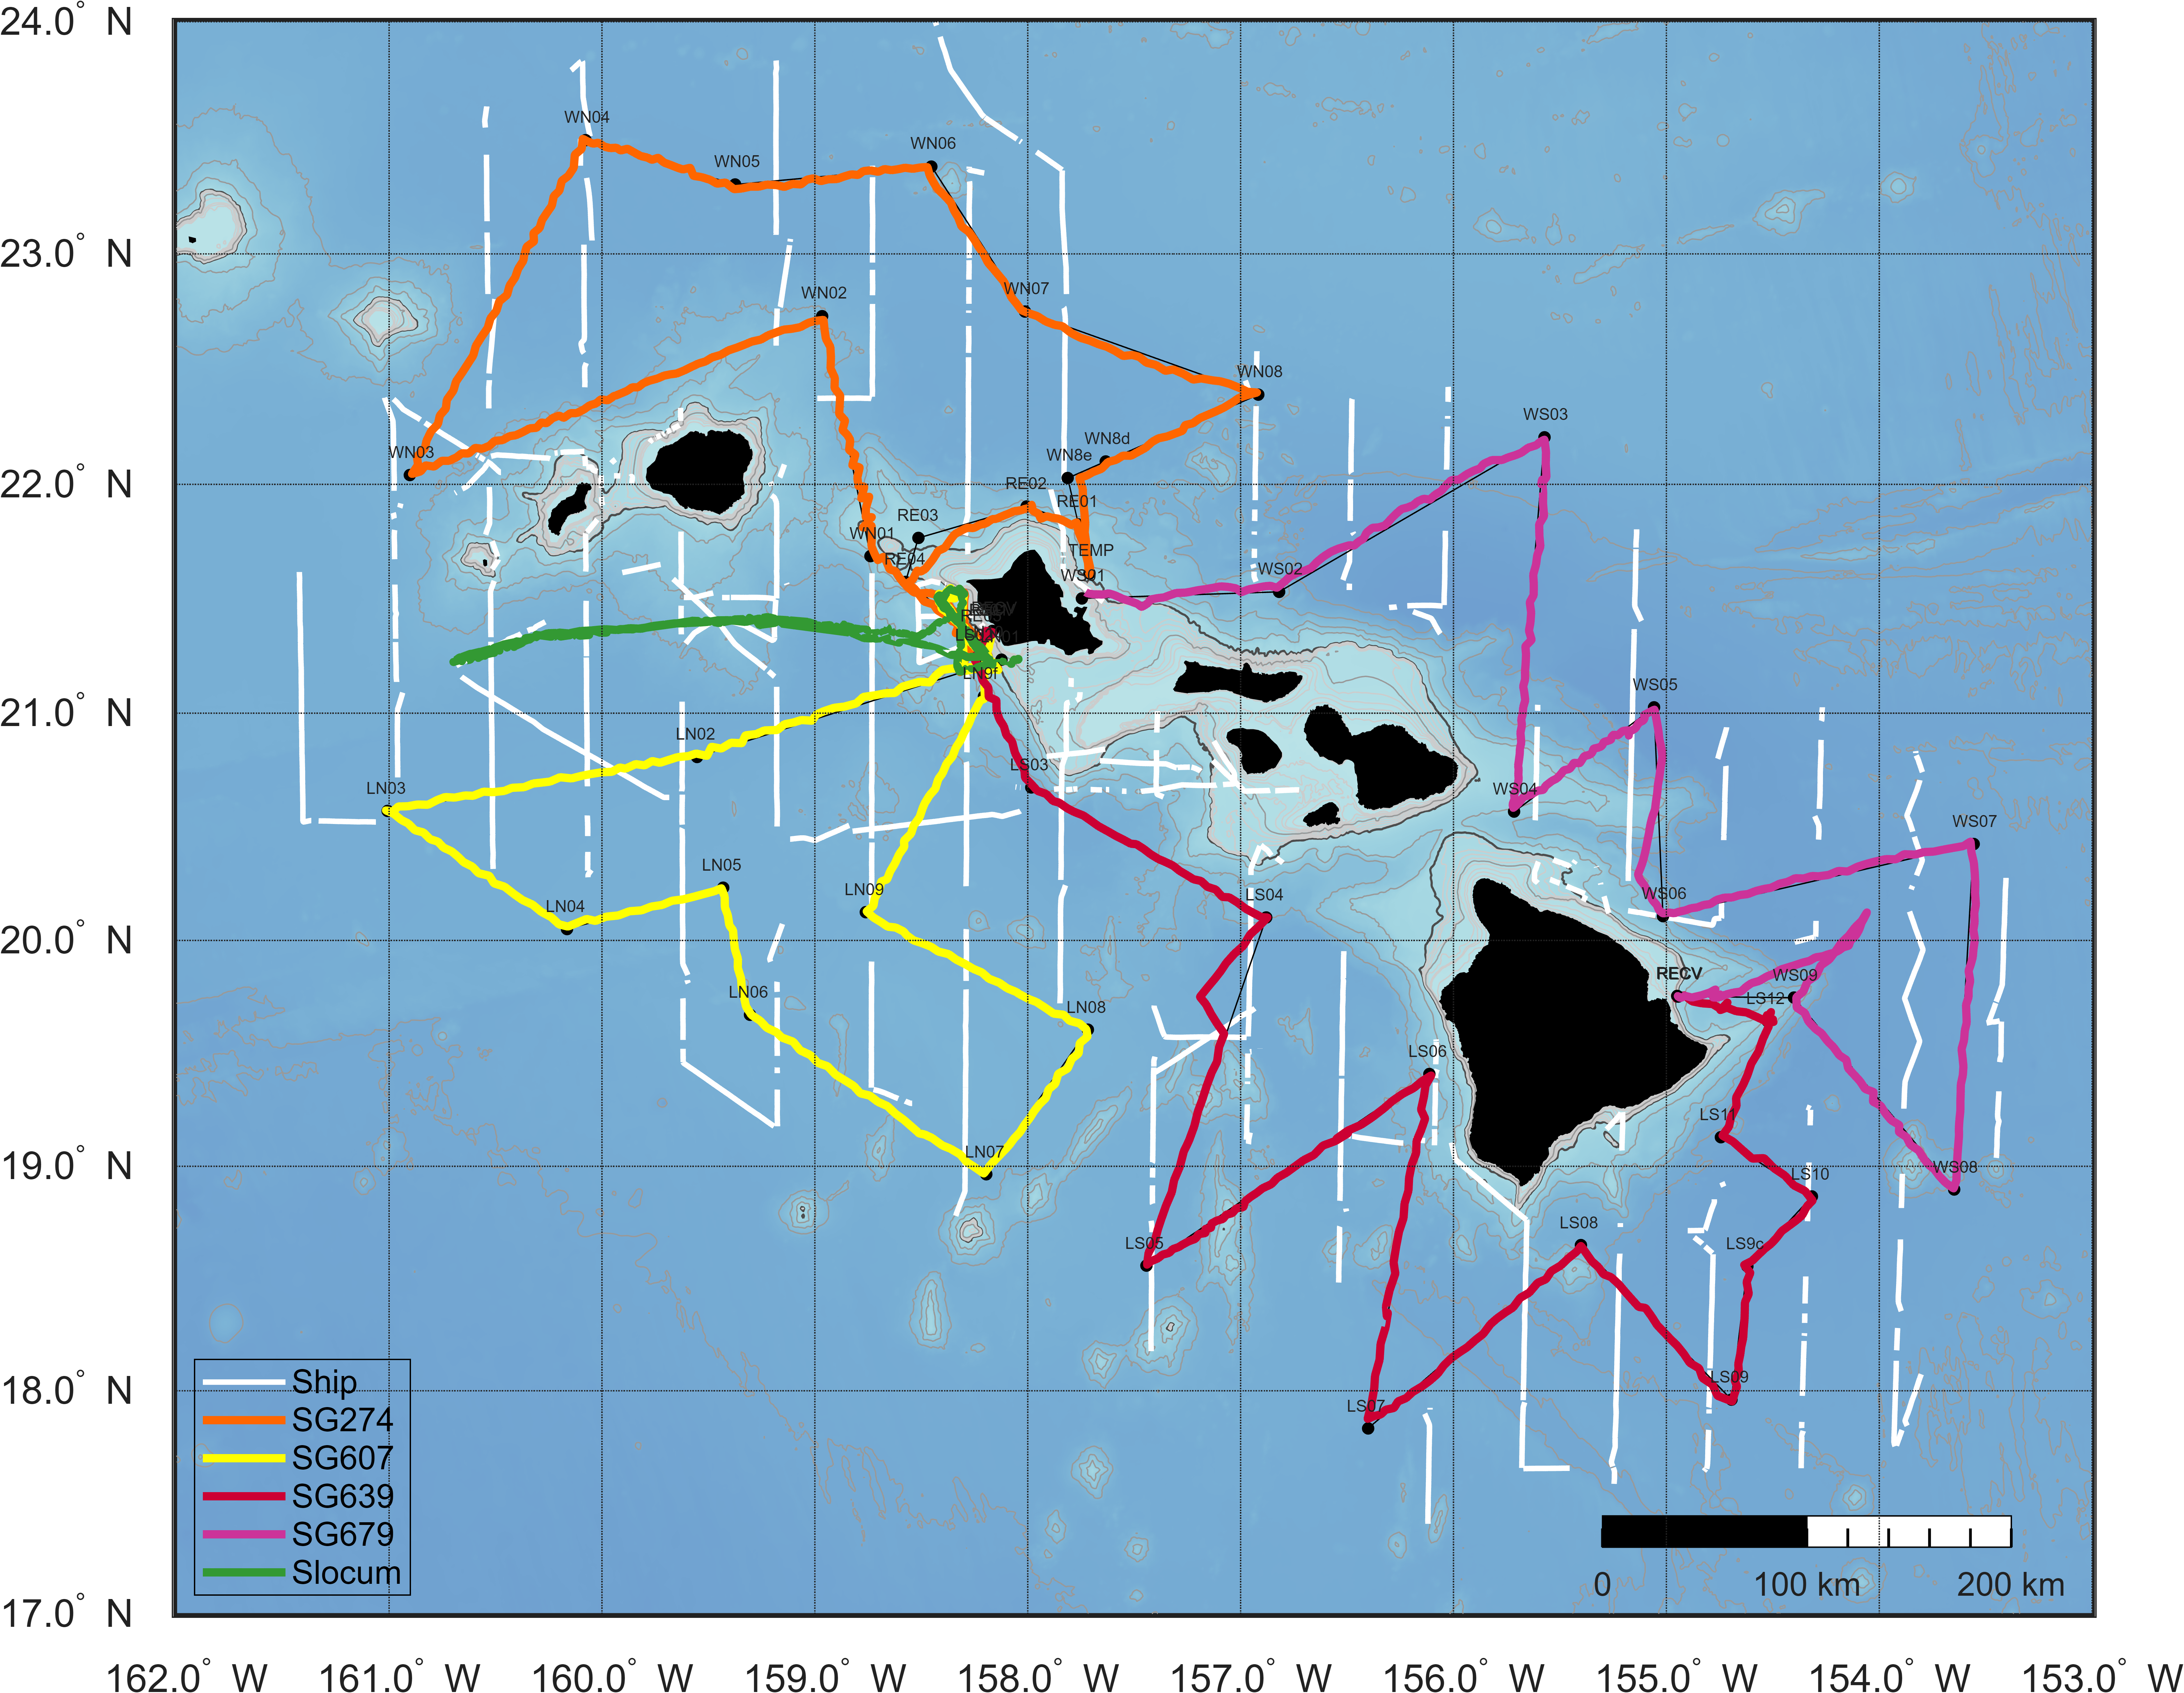
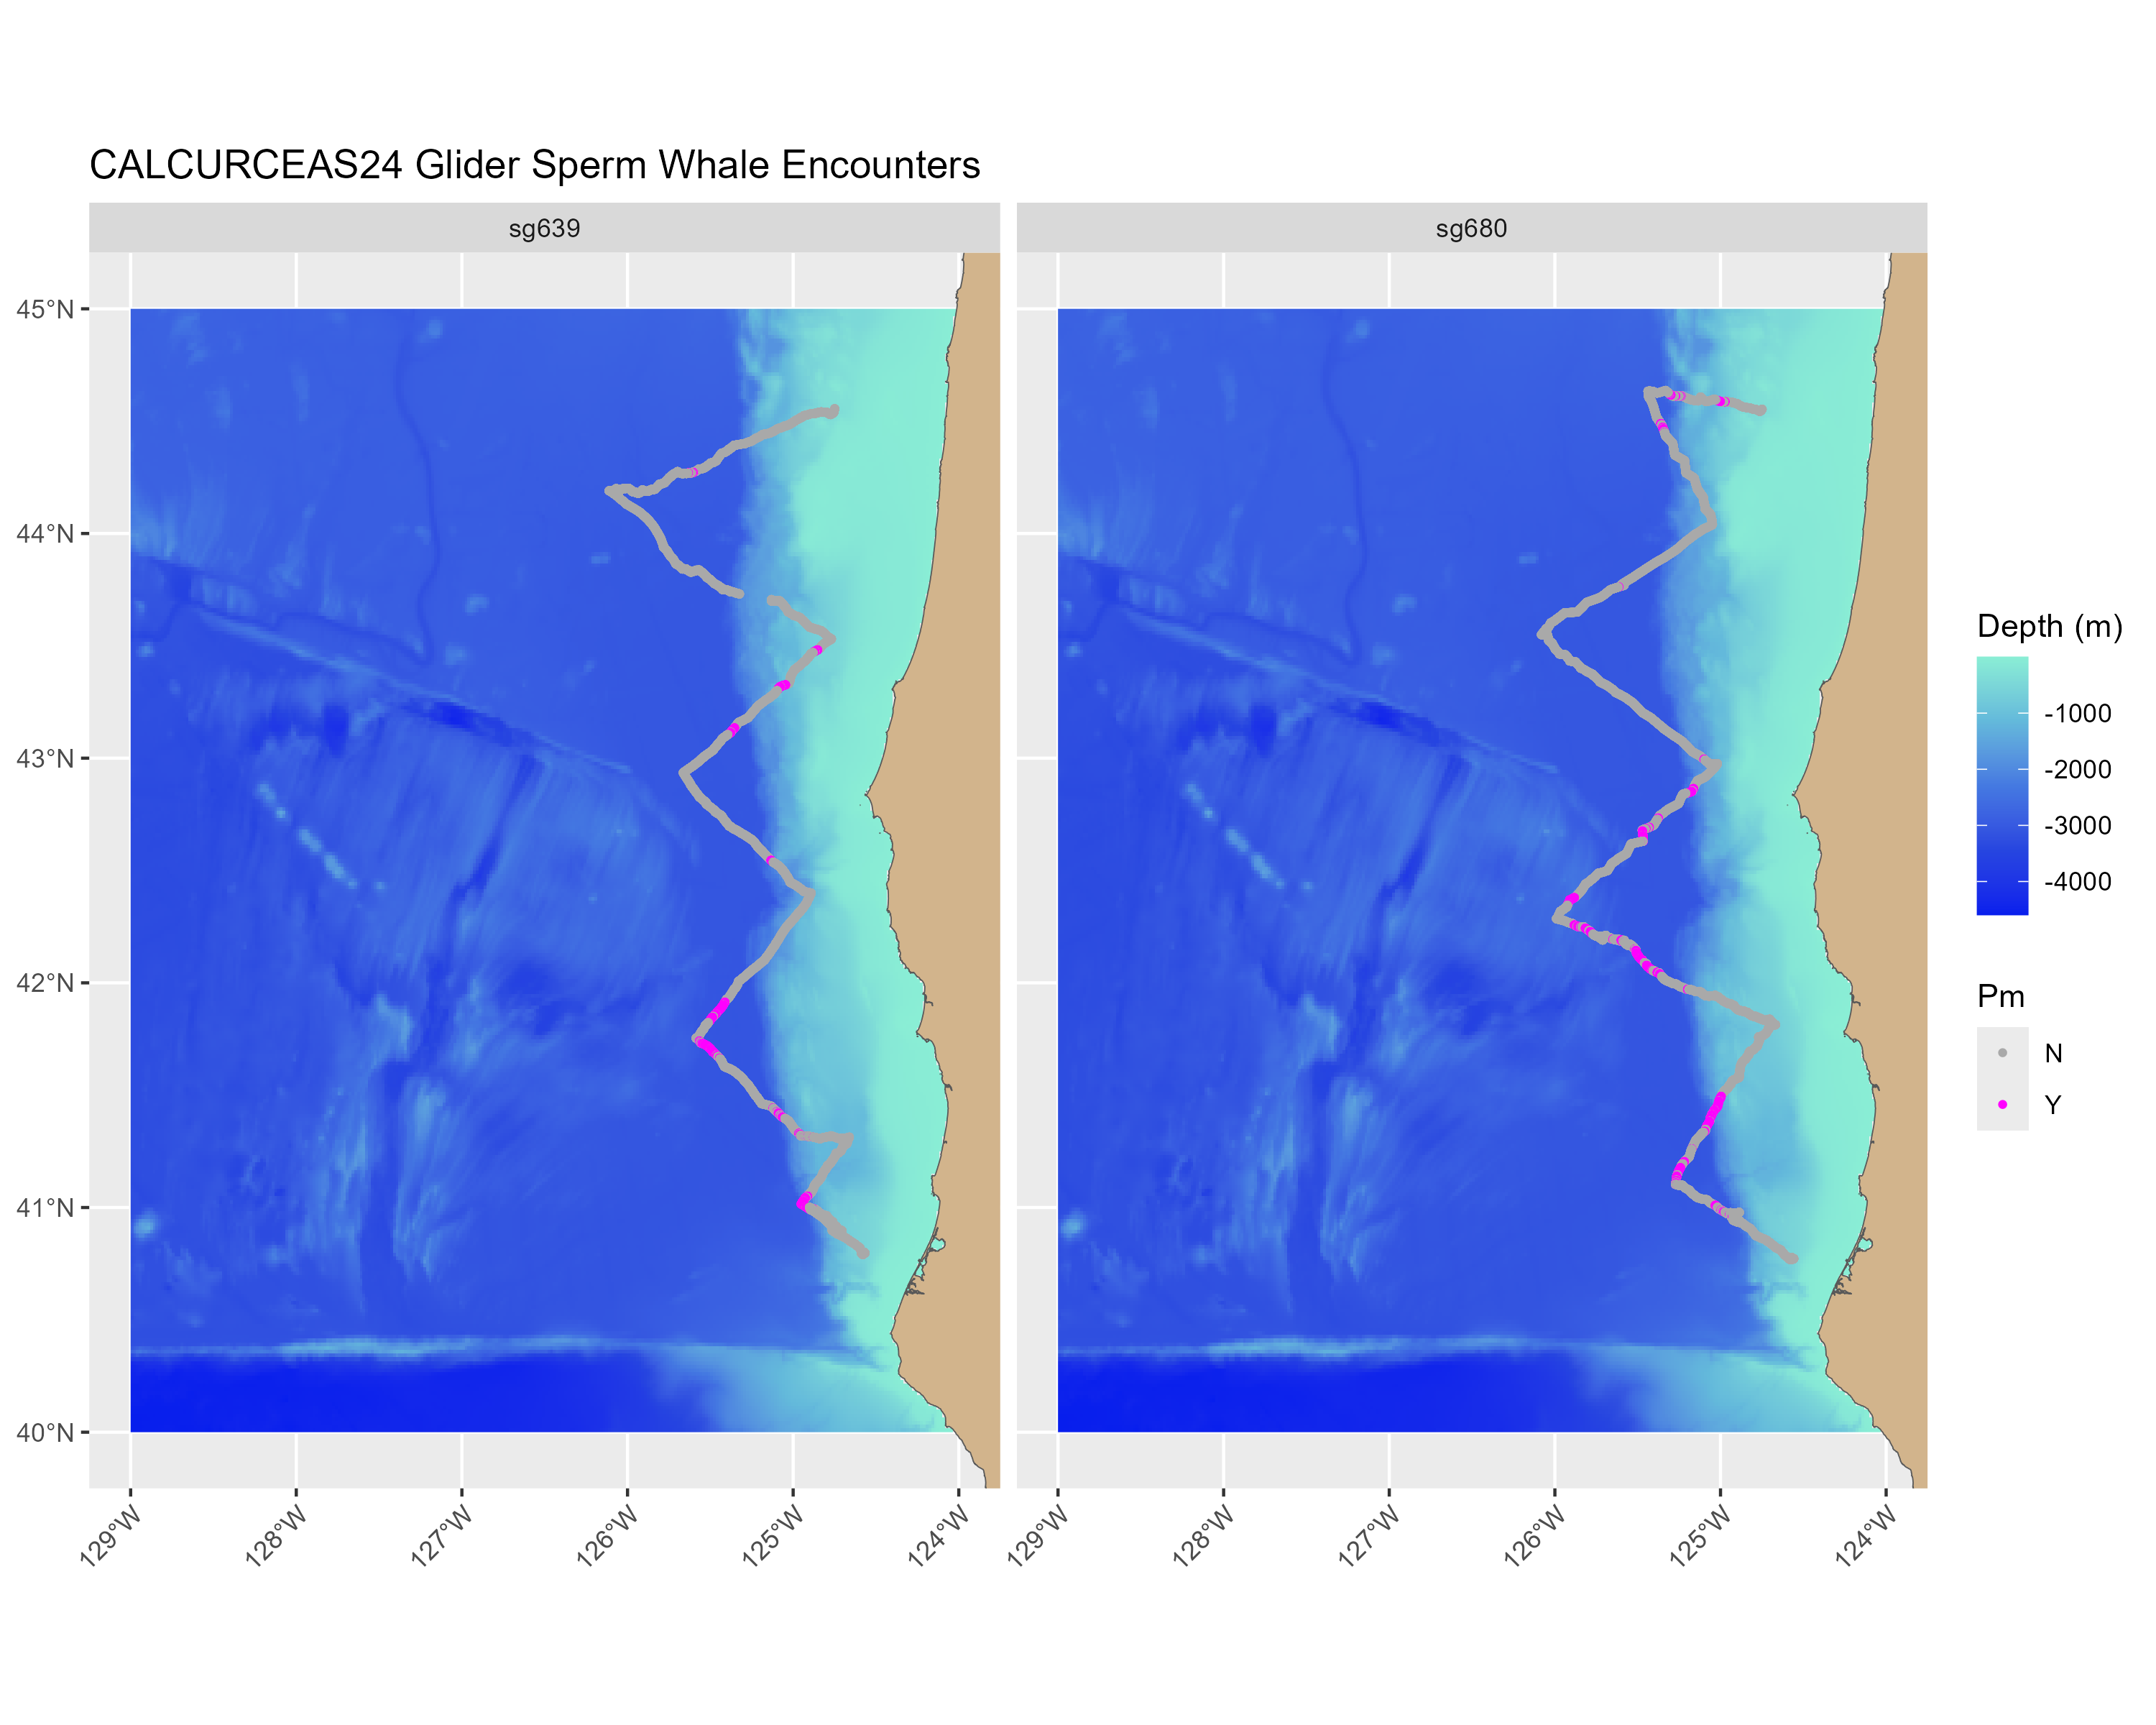
Following the successful completion of glider missions, raw audio files were converted to 60 to 120 second flac files for analysis. These flac files are also compressed as long-term spectral averages (LTSAs), which are used to enable analysts to visualize recordings at longer time scales. Using the MatLab-based package Triton, a trained analyst audited recordings in 15-minute LTSA viewing windows looking for odontocete signals of interest, including sperm whale clicks. When found, sperm whale click bouts were logged at the encounter-level, such that sperm whale clicks with less than 15 minutes of silence before the next click were contained within the same encounter.
Completed detection work: For the two gliders deployed during CalCurCEAS2024, there were a total of 131 encounters, accounting for about 157 hours of data. Sperm whale presence by dive-portion: In order to break a glider deployment into useful segments, each glider’s path was broken into dive-portions (ie Dive001-decent/ascent). Sperm whale presence was graded on a binary basis based on whether any portion of a sperm whale encounter occurred during that portion. In total, there were 125 dives with at least some sperm whale click calling present. Manual click count analysis for detector validation: For each dive-portion where sperm whales were present, a dozen one-minute subsamples were selected at random. For each subsample, a trained analyst manually selected individual sperm whale clicks. This resulted in a groundtruth dataset of 1500 minutes and over 300,000 clicks, which will be used to validate automated detectors used to generate click counts across the entire dataset.
Future detection work: Effort is currently underway to completed automated detection of clicks on CalCurCEAS2024 data and use groundtruth data to generate an adjusted click count within each dive-portion. Following the completion of glider deployments from WHICEAS2026, recording data is being processed and initial analysis for sperm whale encounters is forthcoming.
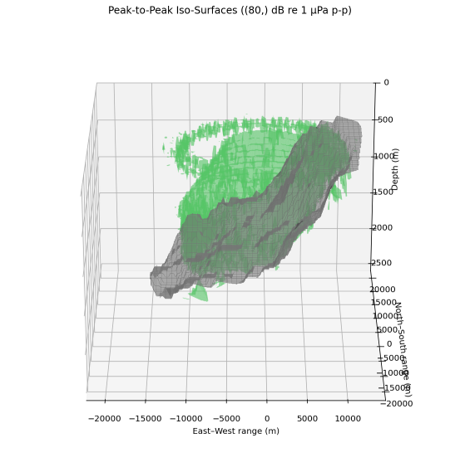
A broadband acoustic detection modeling framework is being developed to quantify the influences of environmental conditions the probability of detecting sperm whale clicks recorded by autonomous gliders. The framework combines acoustic propagation modeling with recorded sperm whale click waveform to estimate broadband received levels and detection probability under realistic oceanographic conditions and typical peak-to-peak time domain measurements.
Acoustic propagation is simulated using the Bellhop ray tracing model with dive-specific sound speed profiles derived from glider CTD observations, local bathymetry from GEBCO, and a suite requency-dependent seafloor properties representative of a variety of sediment types encountered during surveys. Simulations are performed across the full 360° surrounding each glider to capture spatial variability in propagation associated with changing bathymetry, glider depth, seafloor composition, and behavioural conditions of the animals.
A primary challenge has been efficiently storing and processing broadband propagation results. To address this, Bellhop arrival times and amplitudes are preserved within hierarchical HDF5 databases. This approach dramatically reduces storage requirements while retaining the arrival structure needed to reconstruct broadband acoustic propagation. Furthermore, HDF5’s are sharable and easily reproducible. By separating the computationally intensive ray tracing from later signal processing, the propagation result can be reused to evaluate different source signals and behavioral scenarios without rerunning Bellhop.
Broadband received levels are estimated by converting stored arrival structures into impulse responses and transfer functions that are convolved with recorded sperm whale click waveforms. This approach preserves the effects of multipath propagation, phase interference, and frequency-dependent transmission that cannot be captured using narrowband transmission loss estimates alone, while providing an efficient framework for simulating broadband received levels throughout the modeled environment.
Completed modeling work: A scalable processing framework has been developed to evaluate millions of source-receiver combinations spanning multiple glider dives, whale depth distributions, glider operating depths, and seafloor sediment types. Processing workflows fully utilize the PAM-SI virtual machine infrastructure by distributing Bellhop simulations across dozens of processor cores. The resulting propagation products have been integrated into a Monte Carlo framework that quantifies uncertainty in acoustic detectability arising from whale behavior, environmental variability, and sensor configuration. Model outputs include broadband received level fields, spatial detection probability surfaces, and effective detection radius estimates that provide the foundation for passive acoustic distance sampling analyses.
Future modeling work: Following completion of automated click detection, modeled detection probabilities will be combined with observed click rates to estimate effective survey area and ultimately sperm whale density using passive acoustic distance sampling methods. Future efforts are focused on expanding propagation simulations to encompass all multiple species and continue devloping sharable scalable workflows for single-sensor UAV.
Detection of an acoustic signal occurs when \[ R(p, s, \theta) - N >T \] where \(N\) is the noise level, \(T\) is a set threshold, and \(r(p, s, \theta)\) is the received signal for an animal that emitted a click at position \(p=(x,y,z)\) of nominal sound level \(s\) and angle \(\theta\) relative to the glider. The signal level can be decomposed as \[ R(p,s,\theta) = s - L(p)-D(\theta), \] where \(L(p)\) is the transmission loss from the animal at position \(p\) and \(D(\theta)\) is the sound level attenuation of the animal facing angle \(\theta\) relative to the glider.
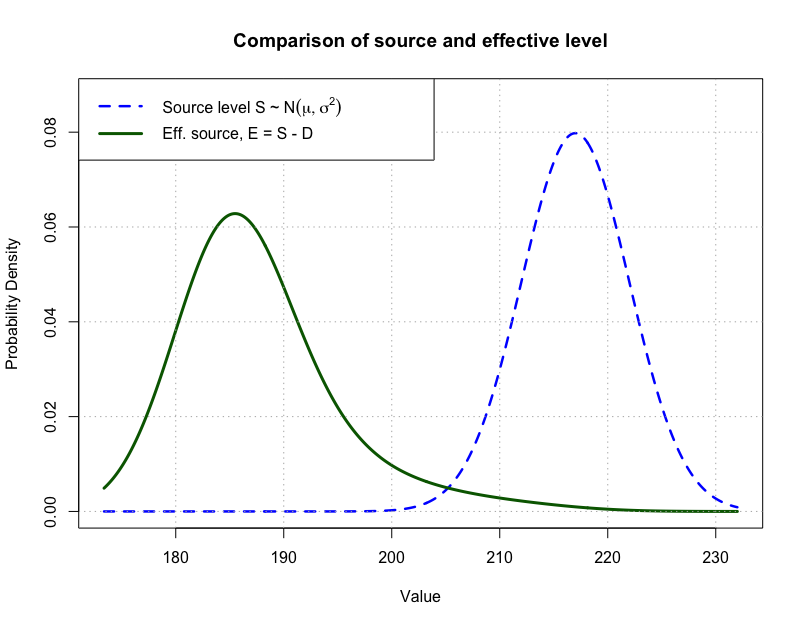
The effective sound level is defined as \[ E(s,\theta) = s-D(\theta), \] and is what sound level the animal produces relative to the hydrophone on the glider.
Because \(p\), \(s\), and \(\theta\) cannot be measured we can describe them as random variables with probability distributions, \(f_P(p) = f_{X,Y}(x,y)\cdot f_Z(z)\), \(f_S(s)\) and \(f_\Theta(\theta)\). Note that I divided the animal location distribution into 2 parts, horizontal location \((x,y)\) and depth, \(z\). So we can assess the probability of detecting a click as, \[ \begin{aligned} P_{cl} &= Pr\{R(P, S, \Theta)>T+N\} \\ &= {\int\int\int}_{R(p, s, \theta)>T+N} f_{P}(p)~f_S(s)~f_\Theta(\theta)~ dp~ds~d\theta. \end{aligned} \]
In addition we also assume there is a known distance beyond which animals will have negligible chance of being detected, say \(w\). In addition to the maximum area of detection, \(A = \pi w^2\), we can also reasonably assume that \(f_{X,Y}(x,y) = 1/A\), i.e., a uniform horizontal distribution. Unfortunately, the same cannot be said of \(f_Z(z)\) because this depends on the diving and vocalizing behavior of the whale. Now, we can begin to estimate this probability for a data set of received clicks, \(r_1,\dots,r_n\).
To begin the estimation process we will develop the likelihood function for a received click. First note that given the animal’s position, \(p\), \[ R(p,S,\Theta) + L(p) ~|~p = E(S,\Theta). \] So, we can define the likelihood for a single received click, \(r\) in terms of the effective source level by conditioning, i.e., \[ \begin{aligned} f_R(r) &= \int f_{R|p}(r)f_P(p) dp \\ &= \int f_{E}(r+L(p))f_P(p) dp \end{aligned} \] where \(f_E\) is the density function of \(E(S,\Theta)\). Thus the likelihood for a single received click of level \(r\) is, \[ \mathcal{L}(r) = \frac{\int f_E(r + L(p))~f_P(p)~dp}{\int \int_{u>T+N+L(p)}f_E(u)~f_P(p)~du~dp} \] The denominator is necessary to normalize the density function because a signal is received only if \(R > T+N\) or equivalently \(E > T + N + L\). One very important side note is that the probability of detecting a single click is, \[ \begin{aligned} P_{cl} &= \int \int_{u>T+N+L(p)}f_E(u)~f_P(p)~du~dp \\ &= \int \left[1-F_E(T+N+L(p))\right]f_P(p)~dp \\ &= \mathbb{E}_P\left[ 1-F_E(T+N+L(p))\right]. \end{aligned} \] where \(F_E\) is the cumulative distribution function of the effective sound level distribution. So, the likelihood for a set of received click levels can be written \[ \begin{aligned} \mathcal{L}(r_1,\dots,r_n) &= \prod_{i=1}^n \frac{ \mathbb{E}_P \left[ f_E(r_i + L(p)\right]}{\mathbb{E}_P\left[ 1-F_E(T+N+L(p))\right]} \\ &\approx \prod_{i=1}^n \frac{ \sum_j \left[ f_E(r_i + L(p_{ij})\right]f_P(p_{ij})}{\sum_j\left[ 1-F_E(T+N+L(p_{ij}))\right]f_P(p_{ij})} \end{aligned} \] where \(p_{ij}\) is a grid of possible positions where \(L(p_{ij})\) is evaluated via sound propagation modeling.
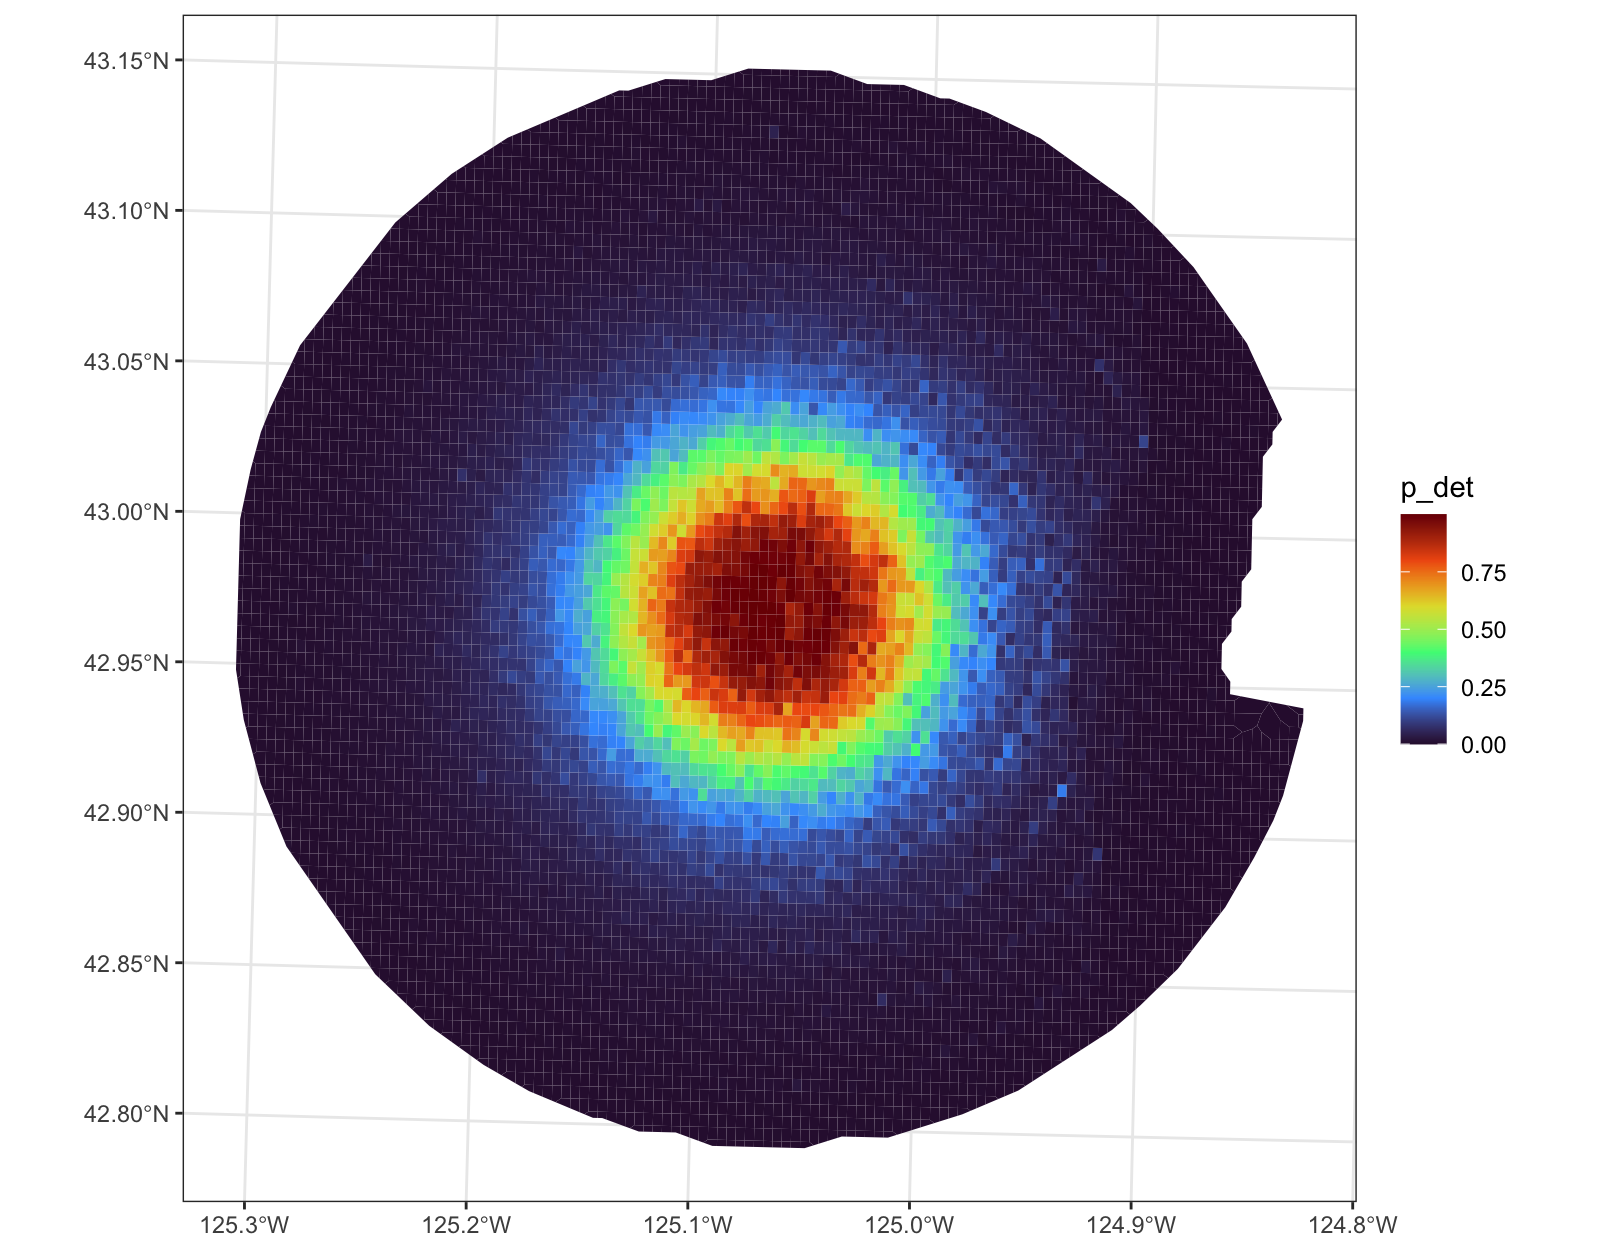
The ultimate goal of the SPACIOUS analytical framework is to translate raw acoustic detections into robust, quantitative assessments of population density and distribution. The density surface model (DSM) integrates the acoustically derived data, such as sperm whale click counts, detection probabilities, and propagation models, with environmental covariates.
By adapting a similar analytical framework used for visual-based models, we will account for the unique spatial and temporal characteristics of slow-moving platforms (like gliders and drifters) to allow for cetacean density predictions across a given survey area. Currently, the team is building and refining these models to seamlessly incorporate uncrewed passive acoustic data from Seagliders and DASBRs for future stock assessments.
Team links
*may require NOAA Google Drive or GitHub enterprise access
Acoustic Glider Spatial Modeling Project Google Drive Folder
PAM-SPACIOUS Retrospective Project
Project update slides
SPACIOUS March 2026 Status Update