Soundscape Technical Documentation
Interest and data for underwater soundscape monitoring is rapidly expanding, necessitating scalable and efficient data handling, processing, and dissemination tools. The NOAA National Marine Fisheries Service (NMFS) passive acoustic monitoring strategic initiative (PAM SI) is one of these efforts, and includes national-level planning for analysis and integration of soundscape metrics. Under the PAM SI, we are building on multi-year progress towards community analysis standards to scale national-level comparable data products from multiple recording technologies and projects. This effort includes refining archival methods, software tools, and baseline soundscape metrics to integrate with species detection and environmental variables.
The Soundscape Working Group is a collection of NOAA affiliated scientists whose research includes a focus on marine soundscapes, including representatives from the Office of National Marine Sanctuaries, NOAA Fisheries Science Centers, NOAA Fisheries OST, Oregon State University CIMERS, NOAA Research PMEL, Woods Hole Oceanographic Institute, and NERACOOS. This page is intended as a place to share the outcomes of various discussions the Soundscape Working Group has had as well as serve as a reference for the broader soundscape community.
Soundscape Terminology
- Soundscape Metrics | raw audio data calibrated to 1-min power-spectral densities in hybrid millidecade frequency bands saved in NCEI netCDF file format, often referred to as sound levels dB re 1 𝜇Pa2/Hz
- Soundscape Labels | soundscape metrics labeled with known acoustic source(s) present. A variety of source detection methods (e.g. marine mammal calls) and non-acoustic data sources are combined with the soundscape metrics (e.g. wind speed, vessel traffic, biological survey). Soundscape labels divide the metrics into different categories to understand how sound levels vary and percent of the time soundscapes are within different categories.
- Soundscape Scenes | a user defined combination of the types of sources present, using the soundscape labels. For example, a biological soundscape scene is only when any biological sound is present.
- Soundscape Condition | tracking how sound levels change in different frequencies using the soundscape metrics. Soundscapes vary across years, seasons, and within a day. Differences are driven by shifts in wind and weather patterns, migration and behavior of animals, and patterns in human activities. Seasonal and annual percentiles of all the data are used to see how daily values fall within ranges for a given monitoring location.
- Ocean Sound Indicators | ocean resource-management relevant metrics derived from long-term monitoring of ocean sound to track status and trends conditions. These indicators track habitat, species, human-use, and management activities. There are many analytical methods used to generate ocean sound indicators. In some locations sound frequencies are dominated by a specific source and we can use this frequency (e.g. 125 Hz for vessel noise) to track conditions. Other methods detect specific sources of interest. For example, the National Marine Fisheries Service (NMFS) maintains analysis of the presence of marine mammals from ocean sound monitoring data.
- Background Soundscape | an estimate of sound levels when no detections are present using an unsupervised separation (e.g. RRPCA) of soundscape metrics into background and transient conditions based on decomposition of the soundscape metrics within a defined frequency band
- Soundscape Features | unsupervised separation of metrics into salient features and unique spectral features (e.g. clustering), dependent on settings for the automated/unsupervised learning and can be defined within sites, seasons, scenes, or management scenarios.
Data Preparation & Quality Control
- Consistent and reliable metadata and quality control processes are critical to large-scale, collaborative, or integrative soundscape projects. The QAQC phases outlined below are intended to propose a standardized process, building on the SoundCoop standard HMD netCDF and metadata output and IOOs standards, to ensure data is comparable.
- Phase 1: Generate NCEI metadata file from audio files
- Intention to run on audio (.WAV/.FLAC) to flag quality before soundscape metric processing – output as comment in the metadata (Passive Packer/PACM) comment field (options - TOL code, manual spectrogram review, LTSA…etc); any additional comments after the semicolon
- Note start/stop of data gaps for documentation in Passive Packer (e.g. “Data gap from 6-Jan-2025 3:03:59 UTC to 6-Jan-2025 7:04:05 UTC”)
- Phase 2: Generate NCEI data quality matrix for HMD soundscape metrics
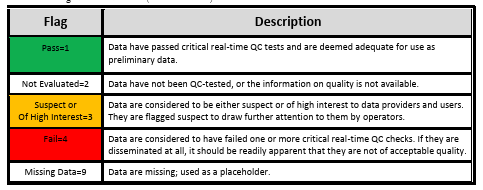
- generate the quality flag (1-4) - matching IOOS standard ( Manual for Real-Time Quality Control of Passive Acoustics Data, page 11),
- IOOS N/A uses “9” for quality matrix, but PyPAM quality matrix functionality still in development - current missing data flag is “NAN”
- IOOS N/A uses “9” for quality matrix, but PyPAM quality matrix functionality still in development - current missing data flag is “NAN”
- The quality matrix is not an output of MANTA netCDF, but will be integrated in future versions of PyPAM netCDF output (under development as part of the MBARI PyPAM-based processing (PBP) package). Current procedure is to apply the quality matrix when data are formatted and ingested at NCEI for the PAM archive.
- NCEI standard is currently applied by NCEI staff during archiving upload.
- Intention to run on audio (.WAV/.FLAC) to flag quality before soundscape metric processing – output as comment in the metadata (Passive Packer/PACM) comment field (options - TOL code, manual spectrogram review, LTSA…etc); any additional comments after the semicolon
- Phase 3: Optional fine-scale review to update data quality matrix in the netCDF
- Analyst to complete post-processing review of all daily LTSA files from soundscape metrics to inform quality matrix either as generated netCDF or as comment field in Passive Packer
- PAMscapes includes an LTSA Reviewer app that functions as a “quality editor” to verify quality of each day from the LTSA. The start/end time and frequency limits of each annotation can be exported and used to update the data quality matrix
- Analyst to complete post-processing review of all daily LTSA files from soundscape metrics to inform quality matrix either as generated netCDF or as comment field in Passive Packer
- Existing documentation: metadata workflow, PAMscapes R process with Shiny App review tool, NEFSC old MATLAB process with examples quality flags, ONMS, NRS
- Phase 1: Generate NCEI metadata file from audio files
Soundscape Analysis Softwares
- Sound level Software
- Triton Soundscape metrics (links to code and papers)
- MANTA - Tim’s video, link to Martin et al paper
- PyPAM - NEFSC how-to guide (link to pbp-batch doc)
- Triton Soundscape metrics (links to code and papers)
- Software outputs- data products
- Data product units - (units from each software/PAMscapes, moving between linear/dB, etc)
- Data product units - (units from each software/PAMscapes, moving between linear/dB, etc)
- NOAA PAM data archiving- see NCEI page
- Explore passive acoustic monitoring sites using the NCEI Passive Acoustic Data Map Viewer. Filter to see specific Monitoring Programs using the drop down on the left panel and request data or access via google cloud.
- PAM data can be submitted to the archive using custom NCEI data preparation tools, see NCEI lab manual here.
- Explore passive acoustic monitoring sites using the NCEI Passive Acoustic Data Map Viewer. Filter to see specific Monitoring Programs using the drop down on the left panel and request data or access via google cloud.
- Summary and Visualization Code
- PAMscapes - Github pages site, CRAN docs, markdown guide TBD..?
- Soundcoop code
- HMD bounds Band comparison by software (HMD, deci-, milli-, PAMscapes)
- Conversion tables for TOL -> OL
- PAMscapes - Github pages site, CRAN docs, markdown guide TBD..?
- Related standards and working groups
Software and Instrument Comparisons
- How do hourly one-third octave band results compare between Triton soundscape metrics (SanctSound process) and Manta soundscape metrics processed by PAMscapes (ONMS sound process)?
- How do soundscape metrics compare between outputs of Manta and PyPAM?
(include description of the dataset used)
- How do soundscape metrics compare between co-deployed instruments?
- NRS PMEL AUH vs SoundTrap
Soundscape Projects
In collaboration with other NOAA line offices, agencies, and academic partners we aim to continue to advance PAM data analysis and integration approaches beyond the PAM SI. A coordinated NOAA soundscapes program will leverage this progress and products to provide information about the status and condition of protected species and environments. Various research programs detailed below provide exemplar datasets for each step in this big data challenge. Current applications for these data include quantifying multi-year regional trends in relation to species presence, anthropogenic factors, and climate patterns.
NOAA Ocean Noise Strategy
Building on the successful conclusion of the NOAA Cetacean & Sound Mapping effort in 2012, NOAA leadership, managers, and researchers collaborated to develop the NOAA-wide Ocean Noise Strategy Roadmap, published in 2016. The Ocean Noise Strategy Roadmap identified a forward looking 10-year vision for reducing ocean noise impacts on NOAA trust resources, strategized implementation through our statutory authorities and expertise, provided a guide for further development of the most effective science-based tools, and outlined a plan for outreach to stakeholders and public education.
NOAA Pacific Marine Environmental Laboratory Noise Reference Station Network Website
The NOAA/National Park Service Noise Reference Station network has been sampling throughout U.S. waters for over a decade. This unique network of hydrophones is a collaborative effort between OAR’s Pacific Marine Environmental Laboratory (PMEL), all NMFS Science Centers, the NOS National Marine Sanctuary System, and the National Park Service to establish and collect consistent and comparable long-term acoustic data sets covering all major regions of the U.S.
Sanctuary Soundscape Monitoring Project
https://sanctsound.ioos.us/index.html
SoundCoop Portal
The Sound Cooperative (SoundCoop) project was a 3-year effort co-funded by the National Oceanic and Atmospheric Administration (NOAA) Integrated Ocean Observing System (IOOS), Bureau for Ocean Energy Management (BOEM), U.S Navy Living Marine Resources, and Office of Naval Research. Its goal was to develop technology in collaboration with the passive acoustic monitoring (PAM) community that enabled scalable processing and access to data for science and management applications. SoundCoop focused on creating standardized and comparable sound level metrics using free software toolkits (MANTA and PyPAM that has been scaled with PyPAM Based Processing). This project, driven by partnerships and framed by four case studies, developed core cyberinfrastructure that future PAM projects can build from.
Scientists from the U.S. and other countries contributed PAM data from 12 long-term monitoring projects. Data from 10 of these projects were used to calculate hybrid millidecade spectra (HMD) across a diversity of labs and instruments. Data from one project had been processed into one-third octave band sound levels and another project had been processed to detect North Atlantic Right Whale (Eubalaena glacialis) calls.
In this portal, these datasets are visualized alongside environmental data to show the benefits of connecting acoustic and non-acoustic information as well as highlight the value of being able to compare across different monitoring efforts.
NOAA Office of National Marine Sanctuaries Soundscape Monitoring
Ocean sound is critical for the survival of many marine animals because it is a primary means of communication, orientation and navigation, finding food, avoiding predators, and choosing mates. Many of the things people do offshore also introduce sound underwater. Therefore, we can use sound to track how people are using offshore spaces, just as we track marine animals. We can also track how human activities that produce underwater sounds interfere with animals’ ability to hear prey, predators, and each other. U.S. national marine sanctuaries are home to many acoustically active marine animals and understanding their presence as well as the impacts of noise is a conservation priority.
Reporting on ocean sound conditions from the ONMS long-term monitoring sites helps to ensure the information is available for sanctuaries. These updated web-based reports include the most recent results for soundscape conditions and ocean sound indicators. The intention of the reports is to
(1) provide ONMS-sound team with updates on available data and general soundscape conditions
(2) provide the ONMS-sound team with a communication tool to show status and trends of soundscape conditions and ocean sound indicators
(3) provide an overview of ocean sound indicators available for condition tracking
ONMS Sound Monitoring Report website coming soon.
NOAA Fisheries Passive Acoustic Monitoring
NOAA Fisheries has a long history, over 20 years in some regions, of passive acoustic monitoring of marine ecosystems. NOAA Fisheries’ PAM programs collect underwater sound recordings of the marine environment. Identification of the sounds produced by protected marine mammal species, fishes, humans, or the environment allows for an understanding of marine soundscapes and provides information on changes in species distribution, behavior and/or density. The technological revolution in PAM over the past decade has allowed both acoustic recorders and analytical approaches to increasingly become an integral part of NOAA Fisheries core science mission. PAM’s capacity for creating long term time series makes it an ideal approach for evaluating changes in species stocks, ecosystem interactions, and climate change. There are currently seven Fisheries PAM programs including each regional Science Center and the Office of Science and Technology’s Ocean Acoustic Program.
IOOS
Parks Australia
The NOAA Northeast Fisheries Science Center Passive Acoustic Branch has a Memorandum of Understanding with the Australian Marine Parks (AMP) to provide passive acoustic monitoring analysis in support of monitoring vessel activity for potential non-compliance in AMP National Park Zones. NEFSC analysts provide regular reports to the AMP staff summarizing the diel and weekday patterns in vessel activity that exhibit maneuvering behaviors, a potential indication of non-compliant activities. These reports are then used by AMP to inform crewed enforcement trips that target time periods of increased potential non-compliance.
Guiding Publications
Gedamke, J., et al. (2016) Ocean Noise Strategy Roadmap. http://cetsound.noaa.gov/road-map
Haver et al. (2018) Monitoring long-term soundscape trends in U.S. Waters: The NOAA/NPS Ocean Noise Reference Station Network
Martin, S.B., Gaudet, B.J., Mann, D.A., Klinck, H., Dugan, P.J., Miksis-olds, J.L., David, K., Boebel, O., Wilson, C.C., Ponirakis, D.W., Moors-murphy, H., Martin, S.B., Gaudet, B.J., Klinck, H., Dugan, P.J., Miksis-olds, J.L., 2021. Hybrid millidecade spectra : A practical format for exchange of long-term ambient sound data Hybrid millidecade spectra : A practical format for exchange of long-term ambient sound data 011203. https://doi.org/10.1121/10.0003324
McKenna et al. (2021). Advancing the interpretation of shallow water marine soundscapes. Frontiers in Marine Science, 8, 719258.
Van Parijs, S. M., Baker, K., Carduner, J., Daly, J., Davis, G. E., Esch, C., … & Staaterman, E. (2021). NOAA and BOEM minimum recommendations for use of passive acoustic listening systems in offshore wind energy development monitoring and mitigation programs. Frontiers in Marine Science, 8, 760840.
Wall et al. (preprint) Big Data, Sound Science, Lasting Impact: a framework for passive acoustic monitoring. https://doi.org/10.1101/2025.04.22.650104
Software and processing tools
Parcerisas, C., 2023. PyPAM: a package to process long-term underwater acoustics data in chunks. https://doi.org/10.5281/ZENODO.10037826
Rueda, C.A., Cline, D., Ryan, J.P., 2024. PBP – PyPAM-Based Processing.
Scripps Whale Acoustics Lab, n.d. Triton Soundscape-Metrics Remora.